Close Lucintel Chat
Didn't Find What You're Looking for?
Call us at +1972 636 5056 or write at helpdesk@Lucintel.com
Ask an Expert Provide Custom Requirements Download Sample Report Search Available Reports
  • helpdesk@Lucintel.com
  • |
  • Call Lucintel +1 972 636 5056
  • |
  • Login
  • |
  • Register
  • |
  • Search
  • |
'
...

The Impact of COVID-19 is included in Waterproofing Admixture Market. Buy it today to get an advantage.

Request the impact of COVID-19 on your product or industry


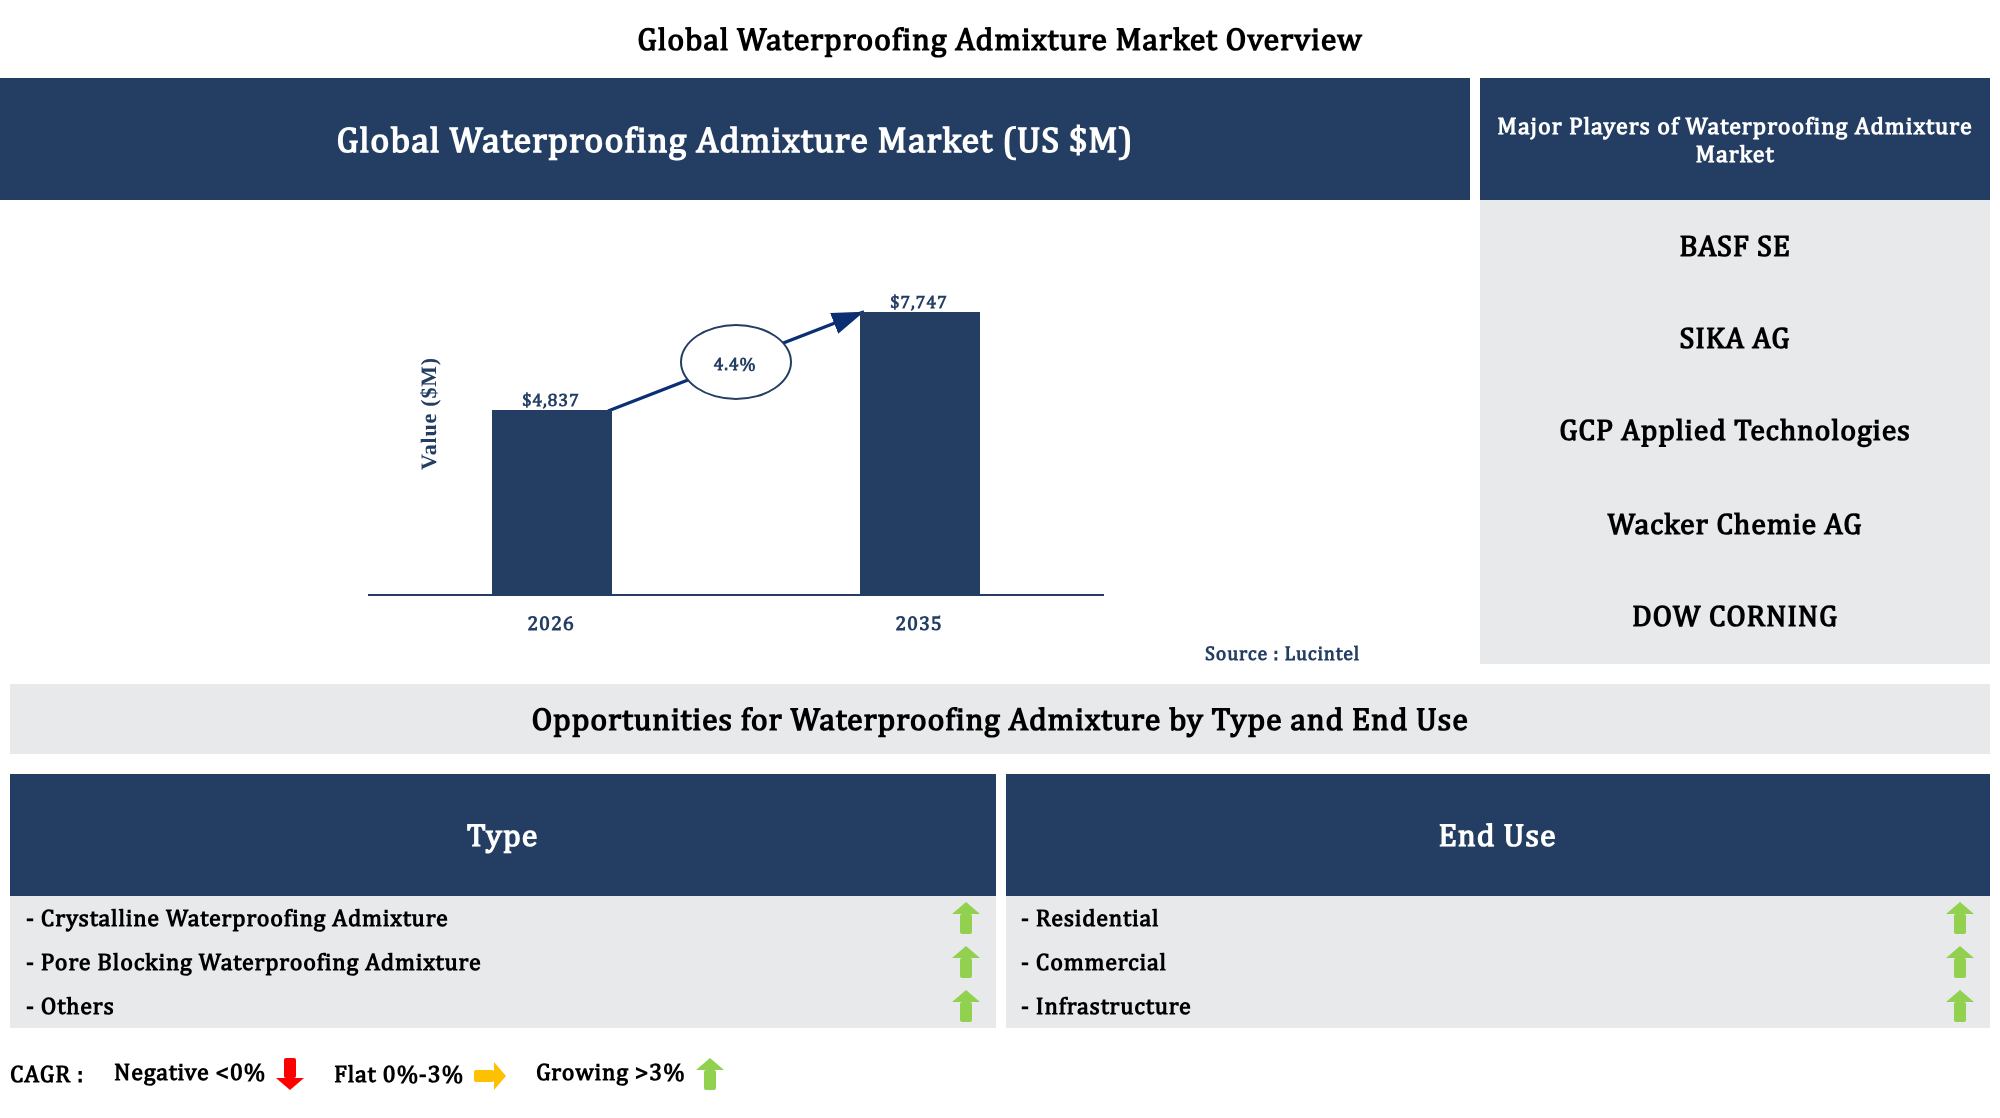
The future of the global waterproofing admixture market looks promising with opportunities in the residential, commercial, and infrastructure sectors. The global waterproofing admixture market is expected to decline in 2020 due to global economic recession led by COVID-19. However, market will witness recovery in the year 2021 and it is expected to reach an estimated $4.7 billion by 2025 with a CAGR of 5% to 7% from 2020 to 2025. The major drivers for growth of the waterproofing admixture market are increasing building and construction activities, renovation of old building structures, and growing awareness on construction quality.

Emerging trends, which have a direct impact on the dynamics of the waterproofing admixture industry, include adoption of performance sheet membrane, liquid applied PU membrane, and cool green waterproofing. 

A total of 85 figures / charts and 62 tables are provided in this 147 -page report to help in your business decisions. Sample figures with some insights are shown below.
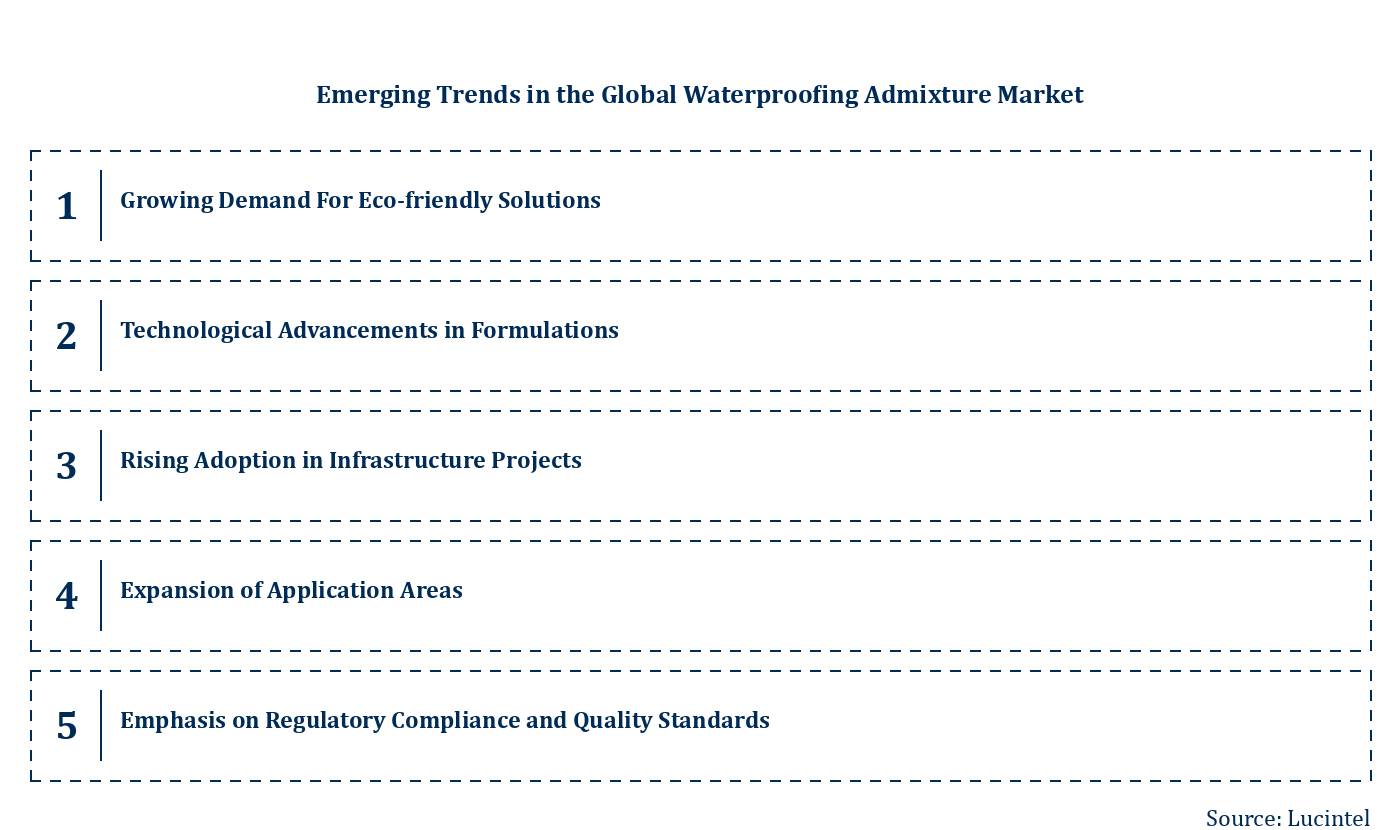
 To learn the scope of, benefits, companies researched and other details of this waterproofing admixture market report, download the report brochure.
 
Waterproofing Admixture Market by Product, and End Use

In this market, residential is the largest market by end use, whereas crystalline is the largest product type. Growth in various segments of the waterproofing admixture market are given below:
 
Waterproofing Admixture Market by Segments

Waterproofing Admixture Market by Segments
 
The study includes the waterproofing admixture market size and forecast for the waterproofing admixture market through 2025, segmented by product type, end use and region as follows:
 
Waterproofing Admixture Market by Product Type [Value ($ Million) from 2014 to 2025]: 
  • Crystalline
  • Pore Blocking
  • Others
Waterproofing Admixture Market by End Use [Value ($ Million) from 2014 to 2025]:
  • Residential
  • Commercial
  • Infrastructure
Waterproofing Admixture Market by Region [Value ($ Million) and Volume (Thousand Tons) from 2014 to 2025]:
  • North America
  • US
  • Canada
  • Mexico
  • Europe
  • Germany
  • France
  • United Kingdom
  • Asia Pacific (APAC)
  • China
  • India
  • Japan
  • The Rest of the World (ROW)
  • Brazil
Some of the waterproofing admixture companies profiled in this report include Sika AG, GCP Applied Technologies, Wacker Chemie, RPM International, BASF SE, and RPM International Inc. 
 
On the basis of comprehensive research, Lucintel forecasts that the crystalline segment is expected to show above average growth during the forecast period. Crystalline waterproofing admixtures are hydrophilic in nature, which means they react with the constituents of the cement matrix to form crystals. Crystalline chemicals facilitate a reaction creating long and narrow crystals that fill the pores, capillaries, and hairline cracks of the concrete mass.
 
By end use sectors, the waterproofing admixture market is segmented into residential, commercial, and infrastructure. The major application areas for waterproofing admixtures are water tanks, toilet sunken area, roof slabs, basement, swimming pools, dams, canals, harbors, and tunnels. Residential is expected to remain the largest segment over the forecast period.
 
By region, APAC is expected to remain the largest market and witness the highest growth rate during the forecast period due to increasing urbanization and higher expenditures on residential and non-residential development in China and India. 
 
Some of the features of this report:
  • Market size estimates: Waterproofing admixture market size estimation in terms of value ($M) and volume (Thousand Tons) shipment.
  • Trend and forecast analysis: Market trend (2014-2019) and forecast (2020-2025) by segments and region.
  • Segmentation analysis: Waterproofing admixture market size by various applications such as product, and end use industry in terms of value and volume shipment.
  • Regional analysis: Waterproofing admixture market breakdown by North America, Europe, Asia Pacific, and the Rest of the World.
  • Growth opportunities: Analysis on growth opportunities in different applications and regions of waterproofing admixture in the waterproofing admixture market.
  • Strategic analysis: This includes M&A, new product development, and competitive landscape of waterproofing admixture in the waterproofing admixture market.
  • Analysis of competitive intensity of the industry based on Porter’s Five Forces model.
This report addresses the following key questions:
 
Q.1. What are some of the most promising, high growth opportunities for the waterproofing admixture market by product type (crystalline, pore blocking and others), end use (residential, commercial and infrastructure), and region (North America, Europe, Asia Pacific, and the Rest of the World)? 
Q.2. Which product segments will grow at a faster pace and why? 
Q.3. Which region will grow at a faster pace and why? 
Q.4. What are the key factors affecting market dynamics? What are the drivers, challenges, and business risks in this waterproofing admixture market? 
Q.5. What are the business risks and competitive threats in this waterproofing admixture market?
Q.6. What are the emerging trends in this waterproofing admixture market and the reasons behind them? 
Q.7. What are some of the changing demands of customers in the waterproofing admixture market? 
Q.8. What are the new developments in the waterproofing admixture market and which companies are leading these developments? 
Q.9. Who are the major players in this waterproofing admixture market? What strategic initiatives are being taken by key companies for business growth? 
Q.10. What are some of the competing products in this waterproofing admixture market and how big of a threat do they pose for loss of market share by product substitution?
Q.11. What M&A activity has occurred in the last 5 years in waterproofing admixture market?

Report Scope
Key Features Description
Base Year for Estimation 2019
Trend Period
(Actual Estimates)
2014-2019
Forecast Period 2020-2025
Pages 147
Market Representation / Units Revenue in US $ Billion and Volume in Million Units
Report Coverage Market Trends & Forecasts, Competitor Analysis, New Product Development, Company Expansion, Merger Acquisitions & Joint Venture, and Company Profiling
Market Segments By product type (crystalline, pore blocking and others), and By end use (residential, commercial and infrastructure)
Regional Scope North America (The United States, Canada, and Mexico), Europe (Germany, France, and United Kingdom), Asia Pacific (China, India,and Japan), and RoW (Brazil)
Customization 10% Customization Without any Additional Cost
 

Table of Contents
 
1. Executive Summary
 
2. Market Background and Classifications
2.1: Introduction, Background, and Classifications
2.2: Supply Chain
2.3: Industry Drivers and Challenges
 
3. Market Trends and Forecast Analysis from 2014 to 2025
3.1: Macroeconomic Trends and Forecast
3.2: Global Waterproofing Admixture Market Trends and Forecast
3.3: Global Waterproofing Admixture Market by Type
3.3.1: Crystalline Waterproofing Admixture
3.3.2: Pore Blocking Waterproofing Admixture
3.3.3: Others 
3.4: Global Waterproofing Admixture Market by End Use
3.4.1: Residential
3.4.2: Commercial
3.4.3: Infrastructure
 
4. Market Trends and Forecast Analysis by Region
4.1: Global Waterproofing Admixture Market by Region
4.2: North American Waterproofing Admixture Market
4.2.1: Market by Type: Crystalline, Pore blocking and others
4.2.2: Market by End Use: Residential, Commercial, and Infrastructure
4.2.3: US Waterproofing Admixture Market
4.2.4: Mexican Waterproofing Market
4.2.5: Canadian Waterproofing Market
4.3: European Waterproofing Admixture Market
4.3.1: Market by Type: Crystalline, Pore blocking, and Others
4.3.2: Market by End Use: Residential, Commercial, and Infrastructure
4.3.3: German Waterproofing Admixture Market
4.3.4: United Kingdom Waterproofing Admixture Market
4.3.5: French Waterproofing Admixture Market
4.4: APAC Waterproofing Admixture Market
4.4.1: Market by Type: Crystalline, Pore blocking, and Others
4.4.2: Market by End Use: Residential, Commercial and Infrastructure
4.4.3: Japanese Waterproofing Admixture Market
4.4.4: Indian Waterproofing Admixture Market
4.4.5: Chinese Waterproofing Admixture Market
4.5: ROW Waterproofing Admixture Market
4.5.1: Market by Type: Crystalline, Pore blocking, and Others
4.5.2: Market by End Use: Residential, Commercial, and Infrastructure
 
5. Competitor Analysis
5.1: Product Portfolio Analysis
5.2: Operational Integration
5.3: Geographical Reach
5.4: Porter’s Five Forces Analysis
 
6. Cost Structure Analysis
6.1: Cost of Goods Sold
6.2: SG&A
6.3: EBITDA Margin
 
7. Growth Opportunities and Strategic Analysis
7.1: Growth Opportunity Analysis
7.1.1: Growth Opportunities for the Global Waterproofing Admixture Market by Type
7.1.2: Growth Opportunities for the Global Waterproofing Admixture Market by End Use
7.1.3: Growth Opportunities for the Global Waterproofing Admixture Market by Region
7.2: Emerging Trends in the Global Waterproofing Admixture Market
7.2.1: New Product Development
7.2.2: Capacity Expansion of the Global Waterproofing Admixture Market
7.2.3: Mergers, Acquisitions, and Joint Ventures in the Global Waterproofing Admixture Market
 
8. Company Profiles of Leading Players
8.1: BASF SE
8.2: SIKA AG
8.3: GCP Applied Technologies
8.4: Wacker Chemie AG
8.5: DOW CORNING
8.6: RPM International Inc.
8.7: Pidilite Industries
8.8: Fosroc International Ltd.
8.9: Evonik Industries AG
8.10: Mapei S.P.A.
 
List of Figures
 
Chapter 2. Market Background and Classifications
Figure 2.1: Application of Waterproofing Admixture
Figure 2.2: Brickbat Coba Method
Figure 2.3: Elastomeric Membrane
Figure 2.4: Pore blocking Admixture
Figure 2.5: Internal structure of Crystalline Concrete
Figure 2.6: Addition of Crystalline Admixtures
Figure 2.7: Classification of Waterproofing Admixture
Figure 2.8: Supply Chain of the Waterproofing Admixture Market
Figure 2.9: Major Drivers and Challenges for the Water Proofing Admixture Market
 
Chapter 3. Market Trends and Forecast Analysis from 2014 to 2025
Figure 3.1: Trends of the Global GDP Growth Rate
Figure 3.2: Trends of the Global Population Growth Rate
Figure 3.3: Trends of the Global Inflation Rate
Figure 3.4: Trends of the Global Unemployment Rate
Figure 3.5: Trends of the Regional GDP Growth Rate
Figure 3.6: Trends of the Regional Population Growth Rate
Figure 3.7: Trends of the Regional Inflation Rate
Figure 3.8: Trends of the Regional Unemployment Rate
Figure 3.9: Regional Per Capita Income Trends
Figure 3.10: Forecast for the Global GDP Growth Rate
Figure 3.11: Forecast for the Global Population Growth Rate
Figure 3.12: Forecast for the Global Inflation Rate
Figure 3.13: Forecast for the Global Unemployment Rate
Figure 3.14: Forecast for the Regional GDP Growth Rate
Figure 3.15: Forecast for the Regional Population Growth Rate
Figure 3.16: Forecast for the Regional Inflation Rate
Figure 3.17: Forecast for the Regional Unemployment Rate
Figure 3.18: Forecast for Regional Per Capita Income
Figure 3.19: Trends and Forecast for the Global Waterproofing Admixture Market (2014-2025)
Figure 3.20: Trends of the Global Waterproofing Admixture Market ($M) by Type (2014-2019)
Figure 3.21: Forecast for the Global Waterproofing Admixture Market ($M) by Type (2020-2025)
Figure 3.22: Trends of Crystalline in the Global Waterproofing Admixture Market ($M) by Region (2014-2019)
Figure 3.23: Forecast for Crystalline in the Global Waterproofing Admixture Market ($M) by Region (2020-2025)
Figure 3.24: Trends of Pore blocking in the Global Waterproofing Admixture Market ($M) by Region (2014-2019)
Figure 3.25: Forecast for Pore Blocking in the Global Waterproofing Admixture Market ($M) by Region (2020-2025)
Figure 3.26: Trends of Others in the Global Waterproofing Admixture Market ($M) by Region (2014-2019)
Figure 3.27: Forecast for Others in the Global Waterproofing Admixture Market ($M) by Region (2020-2025)
Figure 3.28: Trends of the Global Waterproofing Admixture Market ($M) by End Use (2014- 2019)
Figure 3.29: Forecast for the Global Waterproofing Admixture Market ($M) by End Use (2020-2025)
Figure 3.30: Trends of Residential in the Global Waterproofing Admixture Market ($M) by Region (2014-2019)
Figure 3.31: Forecast for Residential in the Global Waterproofing Admixture Market ($M) by Region (2020-2025)
Figure 3.32: Trends of Commercial in the Global Waterproofing Market ($M) by Region (2014-2019)
Figure 3.33: Forecast for Commercial in the Global Waterproofing Admixture Market ($M) by Region (2020-2025)
Figure 3.34: Trends of Infrastructure in the Global Waterproofing Market ($M) by Region (2014-2019)
Figure 3.35: Forecast for Infrastructure in the Global Waterproofing Admixture Market ($M) by Region (2020-2025)
 
Chapter 4. Market Trends and Forecast Analysis by Region
Figure 4.1: Trends of the Global Waterproofing Admixture Market ($M) by Region (2014-2019)
Figure 4.2: Forecast for the Global Waterproofing Admixture Market ($M) by Region (2020-2025)
Figure 4.3: Trends and Forecast for the North American Waterproofing Admixture Market (2014-2025)
Figure 4.4: Trends of the North American Waterproofing Admixture Market ($M) by Type (2014-2019)
Figure 4.5: Forecast for the North American Waterproofing Admixture Market ($M) by Type (2020-2025)
Figure 4.6: Trends of the North American Waterproofing Admixture Market ($M) by End Use (2014-2019)
Figure 4.7: Forecast for the North American Waterproofing Admixture Market ($M) by End Use (2020-2025)
Figure 4.8:  Trends and Forecast for the US Waterproofing Admixture Market (2014-2025)
Figure 4.9:  Trends and Forecast for the Mexican Waterproofing Admixture Market (2014-2025)
Figure 4.10:  Trends and Forecast for the Canadian Waterproofing Admixture Market (2014-2025)
Figure 4.11: Trends and Forecast for the European Waterproofing Admixture Market (2014-2025)
Figure 4.12: Trends of the European Waterproofing Admixture Market ($M) by Type (2014-2019)
Figure 4.13: Forecast for the European Waterproofing Admixture Market ($M) by Type (2020-2025)
Figure 4.14: Trends of the European Waterproofing Admixture Market ($M) by End Use (2014-2019)
Figure 4.15: Forecast for the European Waterproofing Admixture Market ($M) by End Use (2020-2025)
Figure 4.16:  Trends and Forecast for the German Waterproofing Admixture Market (2014-2025)
Figure 4.17:  Trends and Forecast for the United Kingdom Waterproofing Admixture Market (2014-2025)
Figure 4.18:  Trends and Forecast for the French Waterproofing Admixture Market (2014-2025)
Figure 4.19: Trends and Forecast for the APAC Waterproofing Admixture Market (2014-2025)
Figure 4.20: Trends of the APAC Waterproofing Admixture Market ($M) by Type (2014-2019)
Figure 4.21: Forecast for the APAC Waterproofing Admixture Market ($M) by Type (2020-2025)
Figure 4.22: Trends of the APAC Waterproofing Admixture Market ($M) by End Use (2014-2019)
Figure 4.23: Forecast for the APAC Waterproofing Admixture Market ($M) by End Use (2020-2025)
Figure 4.24:  Trends and Forecast for the Japanese waterproofing admixture Market (2014-2025)
Figure 4.25:  Trends and Forecast for the Indian Waterproofing Admixture Market (2014-2025)
Figure 4.25:  Trends and Forecast for the Chinese Waterproofing Admixture Market (2014-2025)
Figure 4.26: Trends and Forecast for the ROW Waterproofing Admixture Market (2014-2025)
Figure 4.27: Trends of the ROW Waterproofing Admixture Market ($M) by Type (2014-2019)
Figure 4.28: Forecast for the ROW Waterproofing Admixture Market ($M) by Type (2020-2025)
Figure 4.29: Trends of the ROW Waterproofing Admixture Market ($M) by End Use (2014-2019)
Figure 4.30: Forecast for the ROW Waterproofing Admixture Market ($M) by End Use (2020-2025)
 
Chapter 5. Competitor Analysis
Figure 5.1: Market Share Analysis of the Global Waterproofing Admixture Market in 2019
Figure 5.2: Global Waterproofing Admixture Market: Top Five Players Market Share Analysis in 2019
Figure 5.3: Headquarters of Competitors in the Global Waterproofing Admixture Market
Figure 5.4: Porter’s Five Forces Industry Analysis for the Global Waterproofing Admixture Market
 
Chapter 6. Cost Structure Analysis
Figure 6.1: Cost Structure Analysis of the Global Waterproofing Admixture Market (%) in 2019
 
Chapter 7. Growth Opportunities and Strategic Analysis
Figure 7.1: Growth Opportunities for the Global Waterproofing Admixture Market by Type
Figure 7.2: Growth Opportunities for the Global Waterproofing Admixture Market by End Use
Figure 7.3: Growth Opportunities for the Global Waterproofing Admixture Market by Region
Figure 7.4: Emerging Trends in the Global Waterproofing Admixture Market
Figure 7.5: Strategic Initiatives by Major Competitors in the Waterproofing Admixture Market
Figure 7.6: Capacity Expansion of the Global Waterproofing Admixture Market
 
List of Tables
 
Chapter 1. Executive Summary
Table 1.1: Global Waterproofing Admixture Market: Parameters and Attributes
 
Chapter 2. Market Background and Classifications
Table 2.1: Waterproofing Admixture by Type and materials Used
 
Chapter 3. Market Trends and Forecast Analysis from 2014 to 2025
Table 3.1: Market Trends of the Global Waterproofing Admixture Market (2014-2019)
Table 3.2: Market Forecast for the Global Waterproofing Admixture Market (2020-2025)
Table 3.3: Market Size and CAGR of Various Types in the Global Waterproofing Admixture Market by Value (2014-2019)
Table 3.4: Market Size and CAGR of Various Types in the Global Waterproofing Admixture Market by Value (2020-2025)
Table 3.5: Market Size and CAGR of Crystalline in the Global Waterproofing Admixture Market by Value (2014-2019)
Table 3.6: Market Size and CAGR of Crystalline in the Global Waterproofing Admixture Market by Value (2020-2025)
Table 3.7: Market Size and CAGR of Pore Blocking in the Global Waterproofing Admixture Market by Value (2014-2019)
Table 3.8: Market Size and CAGR of Pore Blocking in the Global Waterproofing Admixture Market by Value (2020-2025)
Table 3.9: Market Size and CAGR of Various Regions of Others in the Global Waterproofing Admixture Market by Value (2014-2019)
Table 3.10: Market Size and CAGR of Various Regions of Others in the Global Waterproofing Admixture Market by Value (2020-2025)
Table 3.11: Market Size and CAGR of Various End Use of the Global Waterproofing Admixture Market by Value (2014-2019)
Table 3.12: Market Size and CAGR of Various End Use of the Global Waterproofing Admixture Market by Value (2020-2025)
Table 3.13: Market Size and CAGR of Residential in the Global Waterproofing Admixture Market by Value (2014-2019)
Table 3.14: Market Size and CAGR of Residential in the Global Waterproofing Admixture Market by Value (2017-2022)
Table 3.15: Market Size and CAGR of Commercial in the Global Waterproofing Admixture Market by Value (2014-2019)
Table 3.16: Market Size and CAGR of Commercial in the Global Waterproofing Admixture Market by Value (2020-2025)
Table 3.17: Market Size and CAGR of Infrastructure in the Global Waterproofing Admixture Market by Value (2014-2019)
Table 3.18: Market Size and CAGR of Infrastructure in the Global Waterproofing Admixture Market by Value (2020-2025)
 
Chapter 4. Market Trends and Forecast Analysis by Region
Table 4.1: Market Size and CAGR of Various Regions of the Global Waterproofing Admixture Market by Value (2014-2019)
Table 4.2: Market Size and CAGR of Various Regions of the Global Waterproofing Admixture Market by Value (2020-2025)
Table 4.3: Market Size and CAGR of Various Regions of the Global Waterproofing Admixture Market by Volume (2014-2019)
Table 4.4: Market Size and CAGR of Various Regions of the Global Waterproofing Admixture Market by Volume (2020-2025)
Table 4.5: Market Trends of the North American Waterproofing Admixture Market (2014-2019)
Table 4.6:  Market Forecast for the North American Waterproofing Admixture Market (2020-2025)
Table 4.7: Market Size and CAGR of Various Types of the North American Waterproofing Admixture Market by Value (2014-2019)
Table 4.8: Market Size and CAGR of Various Types of the North American Waterproofing Admixture Market by Value (2020-2025)
Table 4.9: Market Size and CAGR of the North American Waterproofing Admixture Market ($M) by End Use (2014-2019)
Table 4.10: Market Size and CAGR of the North American Waterproofing Admixture Market ($M) by End Use (2020-2025)
Table 4.11: Trends and Forecast for the US Waterproofing Admixture Market (2014-2025)
Table 4.12: Trends and Forecast for the Mexican Waterproofing Admixture Market (2014-2025)
Table 4.13: Trends and Forecast for the Canadian Waterproofing Admixture Market (2014-2025)
Table 4.14: Market Trends of the European Waterproofing Admixture Market (2014-2019)
Table 4.15:  Market Forecast for the European Waterproofing Admixture Market (2020-2025)
Table 4.16: Market Size and CAGR of Various Types of the European Waterproofing Admixture Market by Value (2014-2019)
Table 4.17: Market Size and CAGR of Various Types of the North American Waterproofing Admixture Market by Value (2020-2025)
Table 4.18: Market Size and CAGR of the European Waterproofing Admixture Market ($M) by End Use (2014-2019)
Table 4.19: Market Size and CAGR of the European Waterproofing Admixture Market ($M) by End Use (2020-2025)
Table 4.20: Trends and Forecast for the German Waterproofing Admixture Market (2014-2025)
Table 4.21: Trends and Forecast for the United Kingdom Waterproofing Admixture Market (2014-2025)
Table 4.22: Trends and Forecast for the French Waterproofing Admixture Market (2014-2025)
Table 4.23: Market Trends of the APAC Waterproofing Admixture Market (2014-2019)
Table 4.24:  Market Forecast for the APAC Waterproofing Admixture Market (2020-2025)
Table 4.25: Market Size and CAGR of Various Types of the APAC Waterproofing Admixture Market by Value (2014-2019)
Table 4.26: Market Size and CAGR of Various Types of the North American Waterproofing Admixture Market by Value (2020-2025)
Table 4.27: Market Size and CAGR of the APAC Waterproofing Admixture Market ($M) by End Use (2014-2019)
Table 4.28: Market Size and CAGR of the APAC Waterproofing Admixture Market ($M) by End Use (2020-2025)
Table 4.29: Trends and Forecast for the Japanese Waterproofing Admixture Market (2014-2025)
Table 4.30: Trends and Forecast for the Indian Waterproofing Admixture Market (2014-2025)
Table 4.31: Trends and Forecast for the Chinese Waterproofing Admixture Market (2014-2025)
Table 4.32: Market Trends of the ROW Waterproofing Admixture Market (2014-2019)
Table 4.33:  Market Forecast for the ROW Waterproofing Admixture Market (2020-2025)
Table 4.34: Market Size and CAGR of Various Types of the ROW Waterproofing Admixture Market by Value (2014-2019)
Table 4.35: Market Size and CAGR of Various Types of the ROW Waterproofing Admixture Market by Value (2020-2025)
Table 4.36: Market Size and CAGR of the ROW Waterproofing Admixture Market ($M) by End Use (2014-2019)
Table 4.37: Market Size and CAGR of the ROW Waterproofing Admixture Market ($M) by End Use (2020-2025)
 
Chapter 5. Competitor Analysis
Table 5.1: Product Mapping of Waterproofing Admixtures Based on Markets Served
Table 5.2: Rankings of Suppliers Based on Revenue of the Global Waterproofing Admixture Market
Table 5.3: Operational Integration of Waterproofing Admixture Suppliers
 
Chapter 6. Cost Structure Analysis
Table 6.1: Financial Statement for the Global Waterproofing Admixture Market
 
Chapter 7. Growth Opportunities and Strategic Analysis
Table 7.1: New Product Launches by Major Waterproofing Admixture Producers (2014-2019)
 
.

Buy full report or by chapter as follows

Price by License Type:
[-] Hide Chapter Details
[Chapter Number] [Chapter Name] [Chapter Number Of Pages] [Chapter Price]
Title/Chapter Name Pages Price
Full Report: Waterproofing Admixture Market: Trends, Opportunities and Competitive Analysis Full Report $ 4,850
85 figures/charts and 62 tables are provided in this 147 - page report
Chapter - 1: Executive Summary 5 $ 435
1. Executive Summary
Chapter - 2: Market Background and Classifications 12 $ 218
2. Market Background and Classifications
2.1 Introduction, Background, and Classifications
2.2 Supply Chain
2.3 Industry Drivers and Challenges
Chapter - 3: Market Trends and Forecast Analysis 34 $ 1,740
3. Market Trends and Forecast Analysis from 2012 to 2023
3.1 Macroeconomic Trends and Forecast
3.2 Global Waterproofing Admixture Market Trends and Forecast
3.3 Global Waterproofing Admixture Market by Type
3.3.1 Crystalline Waterproofing Admixture
3.3.2 Pore Blocking Waterproofing Admixture
3.3.3 Others
3.4 Global Waterproofing Admixture Market by End Use
3.4.1 Residential
3.4.2 Commercial
3.4.3 Infrastructure
Chapter - 4: Market Trends and Forecast Analysis by Region 34 $ 2,248
4. Market Trends and Forecast Analysis by Region
4.1 Global Waterproofing Admixture Market by Region
4.2 North American Waterproofing Admixture Market
4.2.1 Market by Type: Crystalline, Pore blocking and Others
4.2.2 Market by End Use: Residential, Commercial, and Infrastructure
4.2.3 US Waterproofing Admixture Market
© Lucintel The Global Waterproofing Admixture Market 2018-2023 3
4.2.4 Mexican Waterproofing Market
4.2.5 Canadian Waterproofing Market
4.3 European Waterproofing Admixture Market
4.3.1 Market by Type: Crystalline, Pore blocking, and Others
4.3.2 Market by End Use : Residential, Commercial, and Infrastructure
4.3.3 German Waterproofing Admixture Market
4.3.4 United Kingdom Waterproofing Admixture Market
4.3.5 French Waterproofing Admixture Market
4.4 APAC Waterproofing Admixture Market
4.4.1 Market by Type: Crystalline, Pore blocking, and Others
4.4.2 Market by End Use: Residential, Commercial and Infrastructure
4.4.3 Japanese Waterproofing Admixture Market
4.4.4 Indian Waterproofing Admixture Market
4.4.5 Chinese Waterproofing Admixture Market
4.5 ROW Waterproofing Admixture Market
4.5.1 Market by Type: Crystalline, Pore blocking, and Others
4.5.2 Market by End Use: Residential, Commercial, and Infrastructure
Chapter - 5: Competitor Analysis 9 $ 725
5. Competitor Analysis
5.1 Product Portfolio Analysis
5.2 Operational Integration
5.3 Geographical Reach
5.4 Porter’s Five Forces Analysis
Chapter - 6: Cost Structure Analysis 3 $ 508
6. Cost Structure Analysis
6.1 Cost of Goods Sold
6.2 SG&A
6.3 EBITDA Margin
Chapter - 7: Growth Opportunities and Strategic Analysis 13 $ 870
7. Growth Opportunities and Strategic Analysis
7.1 Growth Opportunity Analysis
7.1.1 Growth Opportunities for the Global Waterproofing Admixture Market by Type
7.1.2 Growth Opportunities for the Global Waterproofing Admixture Market by End Use
7.1.3 Growth Opportunities for the Global Waterproofing Admixture Market by Region
7.2 Emerging Trends in the Global Waterproofing Admixture Market
7.2.1 New Product Development
7.2.2 Capacity Expansion of the Global Waterproofing Admixture Market
7.2.3 Mergers, Acquisitions, and Joint Ventures in the Global Waterproofing Admixture Market
Chapter - 8: Company Profiles of Leading Players 21 $ 508
8. Company Profiles of Leading Players
8.1 BASF SE
8.2 SIKA AG
8.3 GCP Applied Technologies
8.4 Wacker Chemie AG
8.5 DOW CORNING
8.6. RPM International Inc.
8.7. Pidilite Industries
8.8. Fosroc International Ltd
8.9. Evonik Industries AG
8.10. Mapei S.P.A.
Lucintel has been in the business of market research and management consulting since 2000 and has published over 1000 market intelligence reports in various markets / applications and served over 1,000 clients worldwide. This study is a culmination of four months of full-time effort performed by Lucintel's analyst team. The analysts used the following sources for the creation and completion of this valuable report:
  • In-depth interviews of the major players in this market
  • Detailed secondary research from competitors’ financial statements and published data 
  • Extensive searches of published works, market, and database information pertaining to industry news, company press releases, and customer intentions
  • A compilation of the experiences, judgments, and insights of Lucintel’s professionals, who have analyzed and tracked this market over the years.
Extensive research and interviews are conducted across the supply chain of this market to estimate market share, market size, trends, drivers, challenges, and forecasts. Below is a brief summary of the primary interviews that were conducted by job function for this report.
 
Thus, Lucintel compiles vast amounts of data from numerous sources, validates the integrity of that data, and performs a comprehensive analysis. Lucintel then organizes the data, its findings, and insights into a concise report designed to support the strategic decision-making process. The figure below is a graphical representation of Lucintel’s research process. 
 

Please sign in below to get report brochure - Waterproofing Admixture Market.

At Lucintel, we respect your privacy and maintain the confidentiality of information / data provided by you
(Please enter your corporate email. * These fields are mandatory )