
Report Feature
The future of the optical transceiver market looks promising with opportunities in the telecom, enterprise, and data center industries. The global optical transceiver market is expected to grow with a CAGR of 13% from 2019 to 2024. The major drivers for this market are increasing internet penetration and data traffic, growing demand for smartphones and other connecting devices, and mainstream adoption of cloud computing.
A more than 150 pages report is developed to help in your business decisions. Sample figures with some insights are shown below. To learn the scope of, benefits, companies researched and other details of optical transceiver report download the report brochure.
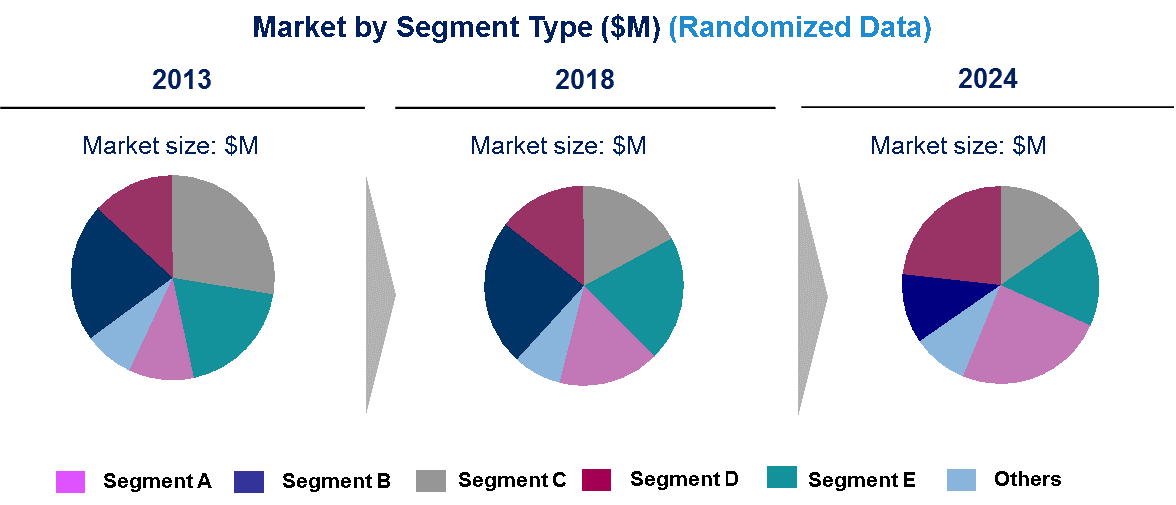

The study includes the optical transceiver size and forecast for the global optical transceiver through 2024, segmented by foam factor, data rate, end use industry, distance, wave length, and region as follows:
By Form Factor [$M shipment analysis for 2013 – 2024]:
By Data Rate [$M shipment analysis for 2013 – 2024]:
By End Use Industry [$M shipment analysis for 2013 – 2024]:
By Distance [$M shipment analysis for 2013 – 2024]:
By Wavelength [$M shipment analysis for 2013 – 2024]:
By Region [$M shipment analysis for 2013 – 2024]:
Some of the optical transceiver companies profiled in this report include Finisar Corp., Accelink Technologies Co., Lumentum Holdings (Oclaro, Japan Inc.), Sumitomo Electric Industries, Foxconn Electronics, Neophotonics, Fujitsu Optical Components, Reflex Photonics, and Source Photonics.
Some of the features of optical transceiver report: Trends, Forecast, and Opportunity Analysis include:
This report answers following 11 key questions:
Q.1 What are some of the most promising potential, high-growth opportunities for the global optical transceiver market, by form factor (SFF and SFP, SFP+ and SFP28, QSFP, QSFP+, QSFP14, and QSFP28, CFP, CFP2, and CFP4, XFP, CXP, and others), data rate (less than 10 Gbps, greater than 10 Gbps and less than 40 Gbps, greater than 40 Gbps and less than 100 Gbps, and greater than 100 Gbps), end use industry (telecom, data center, and enterprise), distance (less than 1km, greater than 1km to less than 10km, greater than 10km to less than 100km, and greater than 100km), wavelength (850nm, 1310nm, and 1550nm), and region (North America, Europe, Asia Pacific, and Rest of the World (ROW))?
Q.2 Which segments will grow at a faster pace and why?
Q.3 Which regions will grow at a faster pace and why?
Q.4 What are the key factors affecting market dynamics? What are the drivers and challenges of the optical transceiver market?
Q.5 What are the business risks and threats to the optical transceiver market?
Q.6 What are emerging trends in this optical transceiver market and the reasons behind them?
Q.7 What are some changing demands of customers in the optical transceiver market?
Q.8 What are the new developments in the optical transceiver market? Which companies are leading these developments?
Q.9 Who are the major players in this optical transceiver market? What strategic initiatives are being implemented by key players for business growth?
Q.10 What are some of the competitive products and processes in this optical transceiver area and how big of a threat do they pose for loss of market share via material or product substitution?
Q.11 What M & A activities have taken place in the last 5 years in this ,optical transceiver market?
A more than 150 pages report is developed to help in your business decisions. Sample figures with some insights are shown below. To learn the scope of, benefits, companies researched and other details of optical transceiver report download the report brochure.
The study includes the optical transceiver size and forecast for the global optical transceiver through 2024, segmented by foam factor, data rate, end use industry, distance, wave length, and region as follows:
By Form Factor [$M shipment analysis for 2013 – 2024]:
- SFF and SFP
- SFP+ and SFP28
- QSFP, QSFP+, QSFP14, and QSFP28
- CFP, CFP2, and CFP4
- XFP
- CXP
- Others
By Data Rate [$M shipment analysis for 2013 – 2024]:
- Less than 10 Gbps
- Greater than 10 Gbps and less than 40 Gbps
- Greater than 40 Gbps and less than 100 Gbps
- Greater than 100 Gbps
By End Use Industry [$M shipment analysis for 2013 – 2024]:
- Telecom
- Data Center
- Enterprise
By Distance [$M shipment analysis for 2013 – 2024]:
- Less than 1km
- Greater than 1km to less than 10km
- Greater than 10km to less than 100km
- Greater than 100km
By Wavelength [$M shipment analysis for 2013 – 2024]:
- 850nm
- 1310nm
- 1550nm
- Others
By Region [$M shipment analysis for 2013 – 2024]:
-
North America
- United States
- Canada
- Mexico
-
Europe
- Germany
- UK
- Italy
-
Asia Pacific
- China
- Japan
- India
- RoW
Some of the optical transceiver companies profiled in this report include Finisar Corp., Accelink Technologies Co., Lumentum Holdings (Oclaro, Japan Inc.), Sumitomo Electric Industries, Foxconn Electronics, Neophotonics, Fujitsu Optical Components, Reflex Photonics, and Source Photonics.
Some of the features of optical transceiver report: Trends, Forecast, and Opportunity Analysis include:
- Market size estimates:Optical transceiver size estimation in terms of value ($M) shipment.
- Trend and forecast analysis: Market trend (2013-2018) and forecast (2019-2024) by end use industry.
- Segmentation analysis: Market size by various segments such as by foam factor, data rate, end use industry, distance, wave length, and region.
- Regional analysis: Optical transceiver breakdown by North America, Europe, Asia Pacific, and the Rest of the World.
- Growth opportunities: Analysis on growth opportunities in different applications and regions for optical transceiver in the optical transceiver.
- Strategic analysis:This includes M&A, new product development, and competitive landscape for, optical transceiver in the optical transceiver.
- Analysis of competitive intensity of the industry based on Porter’s Five Forces model.
This report answers following 11 key questions:
Q.1 What are some of the most promising potential, high-growth opportunities for the global optical transceiver market, by form factor (SFF and SFP, SFP+ and SFP28, QSFP, QSFP+, QSFP14, and QSFP28, CFP, CFP2, and CFP4, XFP, CXP, and others), data rate (less than 10 Gbps, greater than 10 Gbps and less than 40 Gbps, greater than 40 Gbps and less than 100 Gbps, and greater than 100 Gbps), end use industry (telecom, data center, and enterprise), distance (less than 1km, greater than 1km to less than 10km, greater than 10km to less than 100km, and greater than 100km), wavelength (850nm, 1310nm, and 1550nm), and region (North America, Europe, Asia Pacific, and Rest of the World (ROW))?
Q.2 Which segments will grow at a faster pace and why?
Q.3 Which regions will grow at a faster pace and why?
Q.4 What are the key factors affecting market dynamics? What are the drivers and challenges of the optical transceiver market?
Q.5 What are the business risks and threats to the optical transceiver market?
Q.6 What are emerging trends in this optical transceiver market and the reasons behind them?
Q.7 What are some changing demands of customers in the optical transceiver market?
Q.8 What are the new developments in the optical transceiver market? Which companies are leading these developments?
Q.9 Who are the major players in this optical transceiver market? What strategic initiatives are being implemented by key players for business growth?
Q.10 What are some of the competitive products and processes in this optical transceiver area and how big of a threat do they pose for loss of market share via material or product substitution?
Q.11 What M & A activities have taken place in the last 5 years in this ,optical transceiver market?
Table of Contents
1. Executive Summary
7.1: Implications
7.3: Emerging Trends in the Global Optical Transceiver Market
7.2.1: Growth Opportunities for the Global Optical Transceiver Market by Technology..
7.2.2: Growth Opportunities for the Global Optical Transceiver Market by Application
7.2.3: Growth Opportunities for the Global Optical Transceiver Market by Data Rate
7.2.4: Growth Opportunities for the Global Optical Transceiver Market by Region
8.1: Finiser Corp.
8.2: Accelink Technologies Co., Ltd
8.3: Lumentum
8.4: Sumitomo Electric Industries
8.5: Foxconn electronics inc.
8.6: Neo Photonics Corp.
8.7: Fujitsu optical Components Limited
8.8: Reflex Photonics
8.9: Source Photonics Inc
8.10: Shenzhen JHA Technology Co., Ltd
8.11: Optocom Corporation
8.12: Shenzhen, E-link China Technology Co., Ltd. (E-link)
List of Figures
Figure 2.1: Optical Transceiver
Figure 2.2: Evolution of Technologies in Optical Transceiver
Figure 2.3: Technologies and Data Rates in Optical Transceiver Market
Figure 2.4: QSFP Optical Transceiver
Figure 2.5: CFP Optical Transceiver
Figure 2.6: CXP Optical Transceiver
Figure 2.7: SPF Optical Transceiver
Figure 2.8: Basic CX4 Optical Transceiver
Figure 2.9: Technology Mapping
Figure 2.10: Penetration of Technologies in Various Applications
Figure 2.11: Technology Comparison: Data Rate and Wave length
Figure 2.12: Supply Chain of the Global Optical Transceiver Market
Figure 3.1: Level of Technology Maturity, Disruption Potential in Various Markets
Figure 3.2: Level of Technology Maturity, Disruption Potential, etc. in Various Markets
Figure 3.3: Innovation Technology Readiness in the Optical Transceiver Market
Figure 3.4: Major Drivers and Challenges for the Global Optical Transceiver Market
Figure 4.1: Trends and Forecast for the Global optical transceiver market (2013-2024)
Figure 4.2: Technology Trends of the Global Optical Transceiver Market ($M) (2013-2018)
Figure 4.3: Technology Forecast for the Global Optical Transceiver Market ($M) (2019-2024)
Figure 4.4: Technology Trends of the Global Optical Transceiver Market (Thousand Units) (2013-2018)
Figure 4.5: Technology Forecast for the Global Optical Transceiver Market (Thousand Units) (2019-2024)
Figure 4.6: Trends of QSFP in the Global Optical Transceiver Market ($M) by region (2013-2018)
Figure 4.7: Forecast for QSFP in the Global Optical Transceiver Market ($M) by region (2019-2024)
Figure 4.8: Trends of CXP in the Global Optical Transceiver Market ($M) by region (2013-2018)
Figure 4.9: Forecast for CXP in the Global Optical Transceiver Market ($M) by region (2019-2024)
Figure 4.10: Trends of CFP in the Global Optical Transceiver Market ($M) by region (2013-2018)
Figure 4.11: Forecast for CFP in the Global Optical Transceiver Market ($M) by region (2019-2024)
Figure 4.12: Trends of SFP in the Global Optical Transceiver Market ($M) by region (2013-2018)
Figure 4.13: Forecast for SFP in the Global Optical Transceiver Market ($M) by region (2019-2024)
Figure 4.14: Trends of CX4 in the Global Optical Transceiver Market ($M) by Region (2013-2018)
Figure 4.15: Forecast for CX4 in the Global optical transceiver market ($M) by Region (2019-2024)
Figure 4.16: Trends of Others in the Global Optical Transceiver Market ($M) by Region (2013-2018)
Figure 4.17: Forecast for Others in the Global Optical Transceiver Market ($M) by Region (2019-2024)
Figure 4.18: Technology Trends of the Global Optical Transceiver Market by Data Rate ($M) (2013-2018)
Figure 4.19: Technology Forecast for the Global Optical Transceiver Market by Data Rate ($M) (2019-2024)
Figure 4.20: Trends of Less than 40G in the Global Optical Transceiver Market ($M) by Region (2013-2018)
Figure 4.21: Forecast for Less than 40G in the Global Optical Transceiver Market ($M) by Region (2019-2024)
Figure 4.22: Trends of 40G to 100G in the Global Optical Transceiver Market ($M) by Region (2013-2018)
Figure 4.23: Forecast for 40G to 100G in the Global Optical Transceiver Market ($M) by Region (2019-2024)
Figure 4.24: Trends of Above 100G in the Global Optical Transceiver Market ($M) by Region (2013-2018)
Figure 4.25: Forecast for Above 100G in the Global Optical Transceiver Market ($M) by Region (2019-2024)
Figure 4.26: Technology Trends of the Global Optical Transceiver Market ($M) by Application (2013-2018)
Figure 4.27: Technology Forecast for the Global Optical Transceiver Market ($M) by Application (2019-2024)
Figure 4.28: Trends of Data Center in the Global Optical Transceiver Market ($M) by Region (2013-2018)
Figure 4.29: Forecast for Data Center in the Global Optical Transceiver Market ($M) by region (2019-2024)
Figure 4.30: Technology Trends of Data Center in the Global Optical Transceiver Market ($M) (2013-2018)
Figure 4.31: Technology Forecast for Data Center in the Global Optical Transceiver Market ($M) (2019-2024)
Figure 4.32: Trends of the Telecommunication in the Global Optical Transceiver Market ($M) by Region (2013-2018)
Figure 4.33: Forecast for Telecommunication in the Global Optical Transceiver Market ($M) by Region (2019-2024)
Figure 4.34: Technology Trends for Telecommunication by Technology of the Global Optical Transceiver Market ($M) (2013-2018)
Figure 4.35: Technology Forecast for Telecommunication the Global optical transceiver market ($M) (2019-2024)
Figure 4.36: Trends of Enterprise in the Global Optical Transceiver Market ($M) by Region (2013-2018)
Figure 4.37: Forecast for Enterprise in the Global Optical Transceiver Market ($M) by Region (2019-2024)
Figure 4.38: Technology Trends of Enterprise the Global Optical Transceiver Market ($M) (2013-2018)
Figure 4.39: Technology Forecast for Enterprise the Global Optical Transceiver Market ($M) (2019-2024)
Figure 5.1: Trends of the Global Optical Transceiver market ($M) by Region (2013-2018)
Figure 5.2: Forecast for the Global Optical Transceiver Market ($M) by Region (2019-2024)
Figure 5.3: Trends of the Global Optical Transceiver Market (Thousand Units) by Region (2013-2018)
Figure 5.4: Forecast for the Global Optical Transceiver Market (Thousand Units) by Region (2019-2024)
Figure 5.5: Trends and Forecast for the North American Optical Transceiver Market (2013-2024) (Source: Lucintel)
Figure 5.6: Technology Trends of the North American Optical Transceiver Market ($M) (2013-2018)
Figure 5.7: Technology Forecast for the North American Transceiver Market ($M) (2019-2024)
Figure 5.8: Technology Trends of the North American Optical Transceiver Market (Thousand Units) (2013-2018)
Figure 5.9: Technology Forecast for the North American Optical Transceiver Market (Thousand Units) (2019-2024)
Figure 5.10: Trends of the North American Optical Transceiver market ($M) by Application (2013-2018)
Figure 5.11: Forecast for the North American Transceiver Market ($M) by Application (2019-2024)
Figure 5.12: Trends and Forecast for the United States Optical Transceiver Market ($M) (2013-2024)
Figure 5.13: Trends and Forecast for the Canadian Optical Transceiver Market ($M) (2013-2024)
Figure 5.14: Trends and Forecast for the Mexican Optical Transceiver Market ($M) (2013-2024)
Figure 5.15: Trends and Forecast for the European Optical Transceiver Market (2013-2024)
Figure 5.16: Technology Trends of the European Optical Transceiver Market ($M) (2013-2018)
Figure 5.17: Technology Forecast for the European Optical Transceiver Market ($M) (2019-2024)
Figure 5.18: Technology Trends of the European Optical Transceiver Market (Thousand Units) (2013-2018)
Figure 5.19: Technology Forecast for the European Optical Transceiver Market (Thousand Units) (2019-2024)
Figure 5.20: Trends of the European Optical Transceiver Market ($M) by Application (2013-2018)
Figure 5.21: Forecast for the European Transceiver Market ($M) by Application (2019-2024)
Figure 5.22: Trends and Forecast for the United Kingdom Optical Transceiver Market ($M) (2013-2024)
Figure 5.23: Trends and Forecast for the German Optical Transceiver Market ($M) (2013-2024)
Figure 5.24: Trends and Forecast for the French Optical Transceiver Market ($M) (2013-2024)
Figure 5.25: Trends and Forecast for the APAC Optical Transceiver Market (2013-2024)
Figure 5.26: Technology Trends of the APAC Optical Transceiver Market ($M) (2013-2018)
Figure 5.27: Technology Forecast for the APAC Optical Transceiver Market ($M) (2019-2024)
Figure 5.28: Technology Trends of the APAC Optical Transceiver Market (Thousand Units) (2013-2018)
Figure 5.29: Technology Forecast for the APAC Optical Transceiver Market (Thousand Units) (2019-2024)
Figure 5.30: Trends of the APAC Optical Transceiver Market ($M) by Application (2013-2018)
Figure 5.31: Forecast for the APAC Transceiver Market ($M) by Application (2019-2024)
Figure 5.32: Trends and Forecast for the Chinese Optical Transceiver Market ($M) (2013-2024)
Figure 5.33: Trends and Forecast for the Japanese Optical Transceiver Market ($M) (2013-2024)
Figure 5.34: Trends and Forecast for the Indian Optical Transceiver Market ($M) (2013-2024)
Figure 5.35: Trends and Forecast for the APAC Optical Transceiver Market (2013-2024)
Figure 5.36: Technology Trends of the ROW Optical Transceiver Market ($M) (2013-2018)
Figure 5.37: Technology Forecast for the ROW Optical Transceiver market ($M) (2019-2024)
Figure 5.38: Technology Trends of the ROW Optical Transceiver Market (Thousand Units) (2013-2018)
Figure 5.39: Technology Forecast for the APAC Optical Transceiver Market (Thousand Units) (2019-2024)
Figure 5.40: Trends of the ROW Optical Transceiver market ($M) by Application (2013-2018)
Figure 5.41: Forecast for the APAC Transceiver Market ($M) by Application (2019-2024)
Figure 5.42: Trends and Forecast for the Turkish Optical Transceiver Market ($M) (2013-2024)
Figure 5.43: Trends and Forecast for the Brazilian Optical Transceiver Market ($M) (2013-2024)
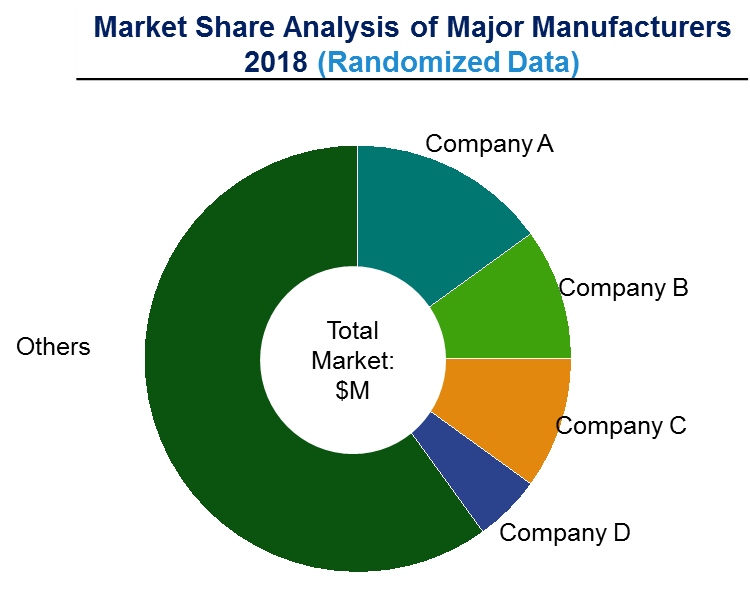
Figure 6.1: Market Share Analysis of the Global Optical Transceiver Market in 2018
Figure 6.2: Market Share of Top Five Suppliers in the Global Optical Transceiver Market in 2018
Figure 6.3: Locations of Major Global Optical Transceiver Suppliers
Figure 6.4: Porter’s Five Forces Industry Analysis for the Global optical transceiver market
Figure 7.1: Data Rate Trend by Technology
Figure 7.2: Data Rate vs Wave Length Trend by Technology
Figure 7.3: Growth Opportunities for the Global Optical Transceiver Market by Technology (2019-2024)
Figure 7.5: Growth Opportunities for the Global Optical Transceiver Market by Data Rate (2019-2024)
Figure 7.6: Growth Opportunities for the Global Optical Transceiver Market by Region (2019-2024)
Figure 7.7: Emerging Trends of the Global Optical Transceiver Market (2019-2024)
Figure 7.8: Strategic Initiatives by Major Competitors in the Global Optical Transceiver Market
Figure 7.9: Major Capacity Expansions in the Global Optical Transceiver Market
List of Tables
Table 4.1: Market Trends of the Global Optical Transceiver Market (2013-2018)
Table 4.2: Market Forecast for the Global Optical Transceiver Market (2019-2024)
Table 4.3: Market Size and CAGR by Technology in the Global Optical Transceiver Market (2013-2018)
Table 4.4: Market Size and CAGR by Technology in the Global Optical Transceiver Market (2019-2024)
Table 4.5: Market Size and CAGR by Technology in the Global Optical Transceiver Mrket (2013-2018)
Table 4.6: Market Size and CAGR by Technology in the Global Optical Transceiver Market (2019-2024)
Table 4.7: Market Size and CAGR of QSFP Technology in the Global Optical Transceiver Market (2013-2018)
Table 4.8: Market Size and CAGR of QSFP Technology in the Global Optical Transceiver Market (2019-2024)
Table 4.9: Market Size and CAGR of CXP Technology in the Global Optical Transceiver Market (2013-2018)
Table 4.10: Market Size and CAGR of CXP Technology in the Global Optical Transceiver Market (2019-2024)
Table 4.11: Market Size and CAGR of CFP Technology in the Global Optical Transceiver Market (2013-2018)
Table 4.12: Market Size and CAGR of CFP Technology in the Global Optical Transceiver Market (2019-2024)
Table 4.13: Market Size and CAGR of SFP Technology in the Global Optical Transceiver Market (2013-2018)
Table 4.14: Market Size and CAGR of SFP Technology in the Global Optical Transceiver Market (2019-2024)
Table 4.15: Market Size and CAGR of CX4 Technology in the Global Optical Transceiver Market (2013-2018)
Table 4.16: Market Size and CAGR of CX4 Technology in the Global Optical Transceiver Market (2019-2024)
Table 4.17: Market Size and CAGR of Others in the Global Optical Transceiver Market (2013-2018)
Table 4.18: Market Size and CAGR of Others in the Global Optical Transceiver Market (2019-2024)
Table 4.19: Market Size and CAGR by Technology in the Global Optical Transceiver market (2013-2018)
Table 4.20: Market Size and CAGR by Data Rate in the Global Optical Transceiver Market (2013-2018)
Table 4.21: Market Size and CAGR of Less than 40G in the Global Optical Transceiver Market (2013-2018)
Table 4.22: Market Size and CAGR of Less than 40G in the Global Optical Transceiver Market (2019-2024)
Table 4.23: Market Size and CAGR of 40G to 100G in the Global Optical Transceiver Market (2013-2018)
Table 4.24: Market Size and CAGR of 40G to 100G in the Global Optical Transceiver Market (2019-2024)
Table 4.25: Market Size and CAGR of Above 100G in the Global Optical Transceiver Market (2013-2018)
Table 4.26: Market Size and CAGR of Above 100G in the Global Optical Transceiver Market (2019-2024)
Table 4.27: Market Size and CAGR by Aplication in the Global Optical Transceiver Market (2013-2018)
Table 4.28: Market Size and CAGR by Application in the Global Optical Transceiver Market (2013-2018)
Table 4.29: Market Size and CAGR of Data Center in the Global Optical Transceiver Market (2013-2018)
Table 4.30: Market Size and CAGR of Data Center in the Global Optical Transceiver Market (2019-2024)
Table 4.31: Market Size and CAGR of Data Center by Technology in the Global Optical Transceiver Market (2013-2018)
Table 4.32: Market Size and CAGR of Data Center by Technology in the Global Optical Transceiver market (2019-2024)
Table 4.33: Market Size and CAGR of Telecommunication in the Global Optical Transceiver Market (2013-2018)
Table 4.34: Market Size and CAGR of Telecommunication in the Global Optical Transceiver Market (2019-2024)
Table 4.35: Market Size and CAGR fro Telecommunication by Technology in the Global Optical Transceiver Market (2013-2018)
Table 4.36: Market Size and CAGR for Telecommunication by Technology in the Global Optical Transceiver Market (2019-2024)
Table 4.37: Market Size and CAGR of Enterprise in the Global Optical Transceiver Market (2013-2018)
Table 4.38: Market Size and CAGR of Enterprise in the Global Optical Transceiver Market (2019-2024)
Table 4.39: Market Size and CAGR for Enterprise by Technology for Enterprise in the Global Optical Transceiver market (2013-2018)
Table 4.40: Market Size and CAGR for Enterprise by Technology in the Global Optical Transceiver market (2019-2024)
Table 5.1: Market Size and CAGR of Various Regions of the Global Optical Transceiver Market (2013-2018)
Table 5.2: Market Size and CAGR of Various Regions of the Global Optical Transceiver Market (2019-2024)
Table 5.3: Market Size and CAGR of Various Regions of the Global Optical Transceiver Market (2013-2018)
Table 5.4: Market Size and CAGR of Various Regions of the Global Optical Transceiver Market (2019-2024)
Table 5.5: Market Trends of the North American Optical Transceiver Market (2013-2018)
Table 5.6: Market Forecast for the North American Optical Transceiver Market (2019-2024)
Table 5.7: Market Size and CAGR by Technology in the Global Optical Transceiver Market (2013-2018)
Table 5.8: Market Size and CAGR by Technology in the Global Optical Transceiver Market (2019-2024)
Table 5.9: Market Size and CAGR by Technology in the North American Optical Transceiver Market (2013-2018)
Table 5.10: Market Size and CAGR by Technology in the North American Optical Transceiver Market (2019-2024)
Table 5.11: Market Size and CAGR by Technology in the Global Optical Transceiver market (2013-2018)
Table 5.12: Market Size and CAGR by Technology in the North American Optical Transceiver Market (2019-2024)
Table 5.13: Trends and Forecast for the United States Optical Transceiver Market (2013-2024)
Table 5.14: Trends and Forecast for the Canadian Optical Transceiver Market (2013-2024)
Table 5.15: Trends and Forecast for the Mexican Optical Transceiver Market (2013-2024)
Table 5.16: Market Trends of the North American Optical Transceiver Market (2013-2018)
Table 5.17: Market Forecast for the North American Optical Transceiver Market (2019-2024)
Table 5.18: Market Size and CAGR by Technology in the Global Optical Transceiver Market (2013-2018)
Table 5.19: Market Size and CAGR by Technology in the European Optical Transceiver Market (2019-2024)
Table 5.20: Market Size and CAGR by Technology in the European Optical Transceiver Market (2013-2018)
Table 5.21: Market Size and CAGR by Technology in the North American Optical Transceiver Market (2019-2024)
Table 5.22: Market Size and CAGR by Technology in the Global Optical Transceiver Market (2013-2018)
Table 5.23: Market Size and CAGR by Technology in the North American Optical Transceiver Market (2019-2024)
Table 5.24: Trends and Forecast for the United Kingdom Optical Transceiver Market (2013-2024)
Table 5.25: Trends and Forecast for the German Optical Transceiver Market (2013-2024)
Table 5.26: Trends and Forecast for the French Optical Transceiver Market (2013-2024)
Table 5.27: Market Trends of the APAC Optical Transceiver Market (2013-2018)
Table 5.28: Market Forecast for the APAC Optical Transceiver Market (2019-2024)
Table 5.29: Market Size and CAGR by Technology in the Global Optical Transceiver Market (2013-2018)
Table 5.30: Market Size and CAGR by Technology in the APAC Optical Transceiver Market (2019-2024)
Table 5.31: Market Size and CAGR by Technology in the European Optical Transceiver Market (2013-2018)
Table 5.32: Market Size and CAGR by Technology in the APAC Optical Transceiver Market (2019-2024)
Table 5.33: Market Size and CAGR by Technology in the APAC Optical Transceiver Market (2013-2018)
Table 5.34: Market Size and CAGR by Technology in the APAC Optical Transceiver Market (2019-2024)
Table 5.35: Trends and Forecast for the Chinese Optical Transceiver Market (2013-2024)
Table 5.36: Trends and Forecast for the Japanese Optical Transceiver Market (2013-2024)
Table 5.37: Trends and Forecast for the Indian Optical Transceiver Market (2013-2024)
Table 5.38: Market Trends of the APAC Optical Transceiver Market (2013-2018)
Table 5.39: Market Forecast for the APAC Optical Transceiver Market (2019-2024)
Table 5.40: Market Size and CAGR by Technology in the ROW Optical Transceiver Market (2013-2018)
Table 5.41: Market Size and CAGR by Technology in the ROW Optical Transceiver Market (2019-2024)
Table 5.42: Market Size and CAGR by Technology in the ROW Optical Transceiver Market (2013-2018)
Table 5.43: Market Size and CAGR by Technology in the ROW Optical Transceiver Market (2019-2024)
Table 5.44: Market Size and CAGR by Technology in the APAC Optical Transceiver Market (2013-2018)
Table 5.45: Market Size and CAGR by Technology in the APAC Optical Transceiver Market (2019-2024)
Table 5.46: Trends and Forecast for the Turkish Optical Transceiver Market (2013-2024)
Table 5.47: Trends and Forecast for the Brazilian Optical Transceiver Market (2013-2024)
Methodology
Lucintel has been in the business of market research and management consulting since 2000 and has published over 1000 market intelligence reports in various markets / applications and served over 1,000 clients worldwide. This study is a culmination of four months of full-time effort performed by Lucintel's analyst team. The analysts used the following sources for the creation and completion of this valuable report:
- In-depth interviews of the major players in this market
- Detailed secondary research from competitors’ financial statements and published data
- Extensive searches of published works, market, and database information pertaining to industry news, company press releases, and customer intentions
- A compilation of the experiences, judgments, and insights of Lucintel’s professionals, who have analyzed and tracked this market over the years.
Extensive research and interviews are conducted across the supply chain of this market to estimate market share, market size, trends, drivers, challenges, and forecasts. Below is a brief summary of the primary interviews that were conducted by job function for this report.

Thus, Lucintel compiles vast amounts of data from numerous sources, validates the integrity of that data, and performs a comprehensive analysis. Lucintel then organizes the data, its findings, and insights into a concise report designed to support the strategic decision-making process. The figure below is a graphical representation of Lucintel’s research process.

Buy Now
Choose a license that fits your team. Instant PDF delivery.
Prices exclude taxes. Instant delivery. Custom licensing available on request.


