
Electronically Scanned Array Market
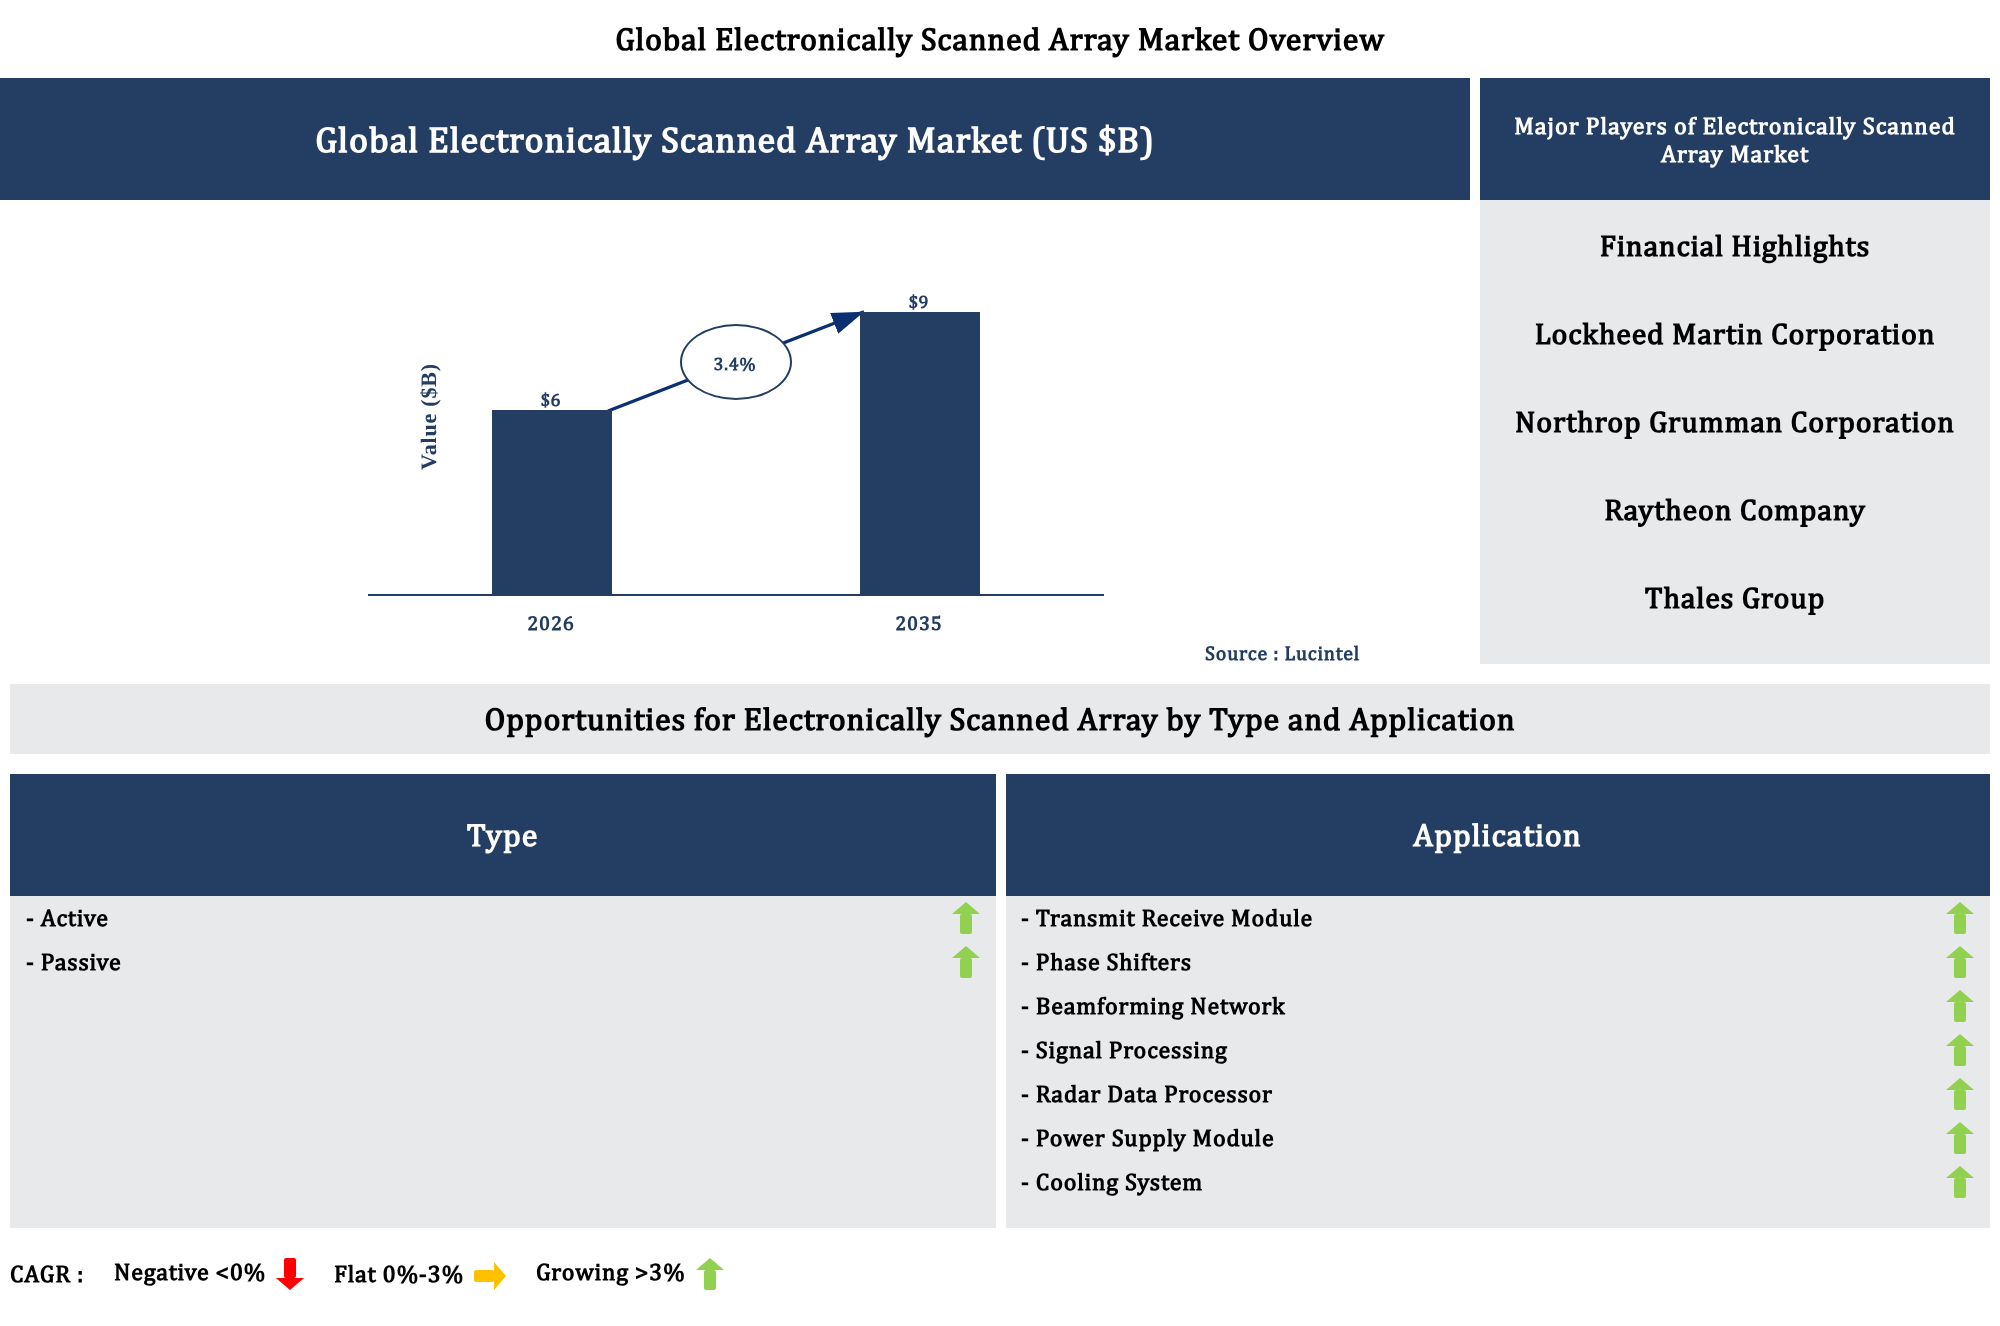
The future of the global electronically scanned array market looks promising with opportunities in the transmit receive module, phase shifter, beamforming network, signal processing, radar data processor, power supply module, and cooling system markets. The global electronically scanned array market is expected to reach an estimated $9 billion by 2035 with a CAGR of 3.4% from 2026 to 2035. The major drivers for this market are the increasing demand for advanced radar surveillance systems, the rising defense electronic warfare investments, and the growing deployment of multifunction phased array radars.
Gain valuable insights for your business decisions with our comprehensive 150+ page report. Sample figures with some insights are shown below.
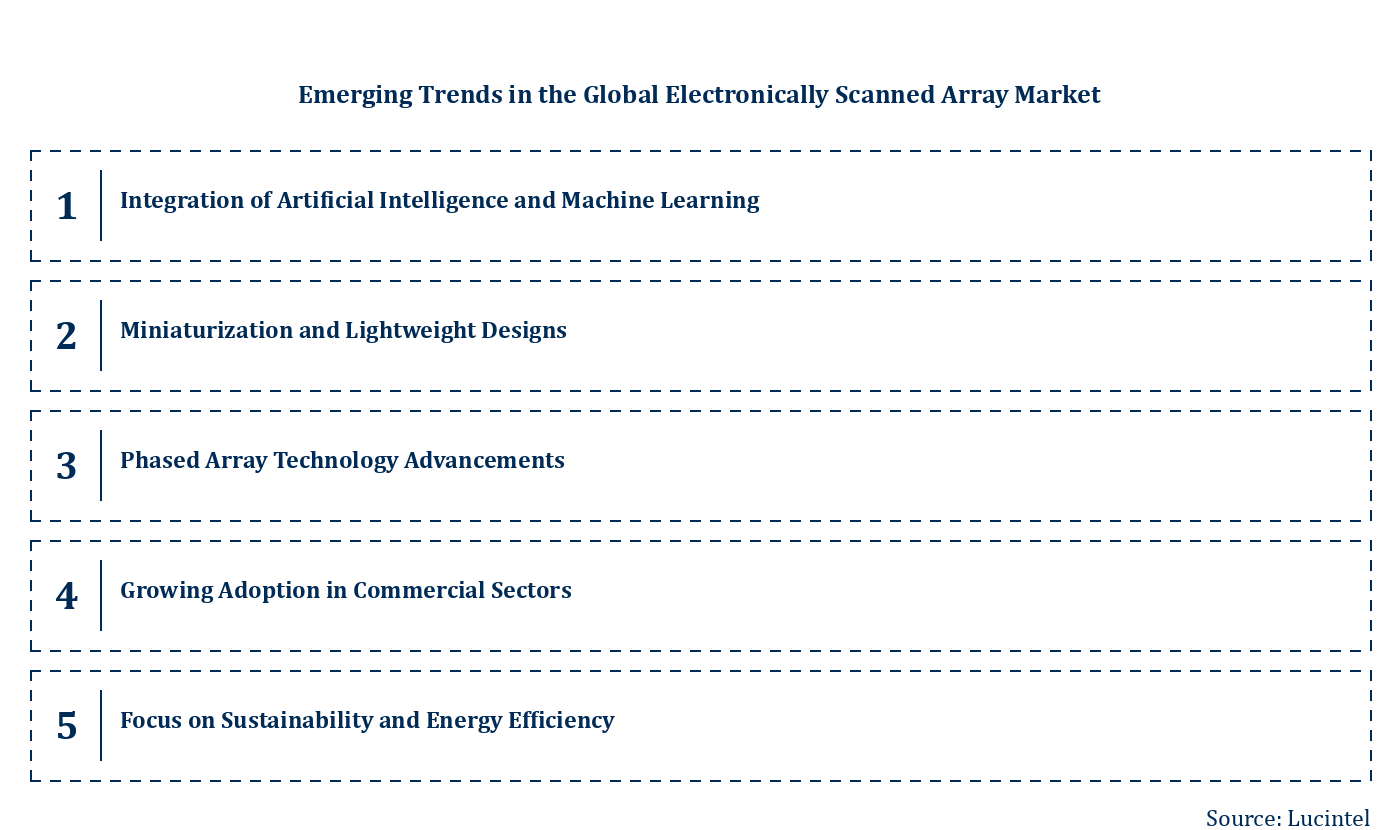
Emerging Trends in the Electronically Scanned Array Market
The electronically scanned array market is experiencing rapid growth driven by technological advancements and increasing demand across various sectors such as defense, aerospace, and commercial applications. As industries seek more precise, reliable, and versatile radar and communication systems, the market is evolving with innovative solutions that enhance performance and operational efficiency. These developments are not only expanding the scope of ESA applications but also fostering competitive dynamics among key players. Understanding the emerging trends is crucial for stakeholders to capitalize on new opportunities and navigate the shifting landscape effectively.
These emerging trends are transforming the electronically scanned array market by enhancing system capabilities, expanding application areas, and promoting sustainable practices. The integration of AI, miniaturization, technological advancements, commercial adoption, and sustainability initiatives are collectively reshaping the landscape, making ESA systems more versatile, efficient, and accessible across multiple industries.
Recent Developments in the Electronically Scanned Array Market
The electronically scanned array market is experiencing rapid growth driven by technological advancements and increasing demand across defense, aerospace, and commercial sectors. Innovations in radar and communication systems are expanding applications, while integration with AI and IoT enhances performance and efficiency. Governments and private industries are investing heavily to develop more sophisticated, reliable, and cost-effective ESA solutions. These developments are shaping the future landscape, creating new opportunities and competitive dynamics within the market.
These developments are transforming the electronically scanned array market by enhancing technological capabilities, expanding application areas, and reducing costs. Increased defense investments, innovation, and integration with AI and IoT are driving growth and competitiveness. The commercial sectors adoption further broadens the market scope, fostering innovation and diversification. Overall, these opportunities are positioning the ESA market for sustained growth, increased market share, and technological leadership in the coming years.
Strategic Growth Opportunities in the Electronically Scanned Array Market
The electronically scanned array market is experiencing rapid growth driven by advancements in radar and communication systems, defense applications, and aerospace innovations. Increasing demand for high-resolution, fast, and reliable electronic scanning solutions is fueling market expansion. Key applications such as military radar, weather monitoring, and satellite communications are adopting ESA technology for enhanced performance. Emerging markets and technological innovations present significant opportunities for industry players to expand their product portfolios and capture new customer segments.
The overall market is poised for substantial growth as these opportunities foster innovation, enhance system capabilities, and expand application domains. Industry players that leverage technological advancements and diversify their offerings will be well-positioned to capitalize on emerging demand, ensuring sustained market expansion and competitive advantage.
Electronically Scanned Array Market Drivers and Challenges
The electronically scanned array market is influenced by a variety of technological, economic, and regulatory factors. Rapid advancements in radar technology, increasing defense budgets, and the need for advanced surveillance systems are key drivers propelling market growth. Simultaneously, regulatory restrictions on military exports and high development costs pose significant challenges. The markets evolution is also shaped by geopolitical tensions and the demand for enhanced security solutions. Understanding these drivers and challenges is essential for stakeholders aiming to capitalize on emerging opportunities while navigating potential obstacles in this dynamic industry.
The factors responsible for driving the electronically scanned array market include:-
The challenges in the electronically scanned array market are:
The electronically scanned array market is driven by technological progress, increased defense spending, and expanding applications across sectors. However, high costs, regulatory restrictions, and rapid technological changes pose significant challenges. These factors collectively influence the markets growth trajectory, requiring stakeholders to innovate strategically and navigate complex regulatory landscapes. Overall, the markets future depends on balancing these drivers and challenges to foster sustainable growth and technological advancement.
List of Electronically Scanned Array Market Companies
Companies in the market compete on the basis of product quality offered. Major players in this market focus on expanding their manufacturing facilities, R&D investments, infrastructural development, and leverage integration opportunities across the value chain. Through these strategies electronically scanned array market companies cater increasing demand, ensure competitive effectiveness, develop innovative products & technologies, reduce production costs, and expand their customer base. Some of the electronically scanned array market companies profiled in this report include-
Electronically Scanned Array Market by Segment
The study includes a forecast for the global electronically scanned array market by type, application, and region.
Country Wise Outlook for the Electronically Scanned Array Market
The electronically scanned array market has experienced significant growth driven by advancements in defense, aerospace, and telecommunications sectors worldwide. As technology evolves, countries are investing heavily in developing more sophisticated, reliable, and cost-effective ESA systems to enhance their military capabilities and communication networks. The market's expansion is also fueled by increasing demand for radar and sensor systems in commercial applications, alongside government initiatives to modernize defense infrastructure. These developments reflect a global race to lead in high-tech radar and communication solutions, with each country focusing on innovation, strategic partnerships, and regulatory support to strengthen their positions.
Features of the Electronically Scanned Array Market
Top 5 Companies
Table of Contents
List of Figures
List of Tables
Methodology
Lucintel has been in the business of market research and management consulting since 2000 and has published over 1000 market intelligence reports in various markets / applications and served over 1,000 clients worldwide. This study is a culmination of four months of full-time effort performed by Lucintel's analyst team. The analysts used the following sources for the creation and completion of this valuable report:
- In-depth interviews of the major players in this market
- Detailed secondary research from competitors' financial statements and published data
- Extensive searches of published works, market, and database information pertaining to industry news, company press releases, and customer intentions
- A compilation of the experiences, judgments, and insights of Lucintel's professionals, who have analyzed and tracked this market over the years.
Extensive research and interviews are conducted across the supply chain of this market to estimate market share, market size, trends, drivers, challenges, and forecasts. Below is a brief summary of the primary interviews that were conducted by job function for this report.

Thus, Lucintel compiles vast amounts of data from numerous sources, validates the integrity of that data, and performs a comprehensive analysis. Lucintel then organizes the data, its findings, and insights into a concise report designed to support the strategic decision-making process. The figure below is a graphical representation of Lucintel's research process.

Buy Now
Choose a license that fits your team. Instant PDF delivery.
Prices exclude taxes. Instant delivery. Custom licensing available on request.
Frequently Asked Questions
What is the electronically scanned array market size?
What is the growth forecast for electronically scanned array market?
What are the major drivers influencing the growth of the electronically scanned array market?
What are the major segments for electronically scanned array market?
Who are the key electronically scanned array market companies?
Some of the key electronically scanned array companies are as follows:
- Financial Highlights
- Lockheed Martin Corporation
- Northrop Grumman Corporation
- Raytheon Company
- Thales Group
- SAAB AB
- Leonardo-Finmeccanica
- Israel Aerospace Industries Ltd.
- Rada Electronic Industries Ltd.
- Reutech Radar Systems
Which electronically scanned array market segment will be the largest in future?
In electronically scanned array market, which region is expected to be the largest in next 8 years?
Do we receive customization in this report?
Key Questions
- • What are some of the most promising, high-growth opportunities for the electronically scanned array market by type (active and passive), application (transmit receive module, phase shifters, beamforming network, signal processing, radar data processor, power supply module, and cooling system), and region (North America, Europe, Asia Pacific, and the Rest of the World)?
- • Which segments will grow at a faster pace and why?
- • Which region will grow at a faster pace and why?
- • What are the key factors affecting market dynamics? What are the key challenges and business risks in this market?
- • What are the business risks and competitive threats in this market?
- • What are the emerging trends in this market and the reasons behind them?
- • What are some of the changing demands of customers in the market?
- • What are the new developments in the market? Which companies are leading these developments?
- • Who are the major players in this market? What strategic initiatives are key players pursuing for business growth?
- • What are some of the competing products in this market and how big of a threat do they pose for loss of market share by material or product substitution?
- • What M&A activity has occurred in the last 5 years and what has its impact been on the industry?


