
Composites Market Report: Trends, Forecast and Competitive Analysis to 2035

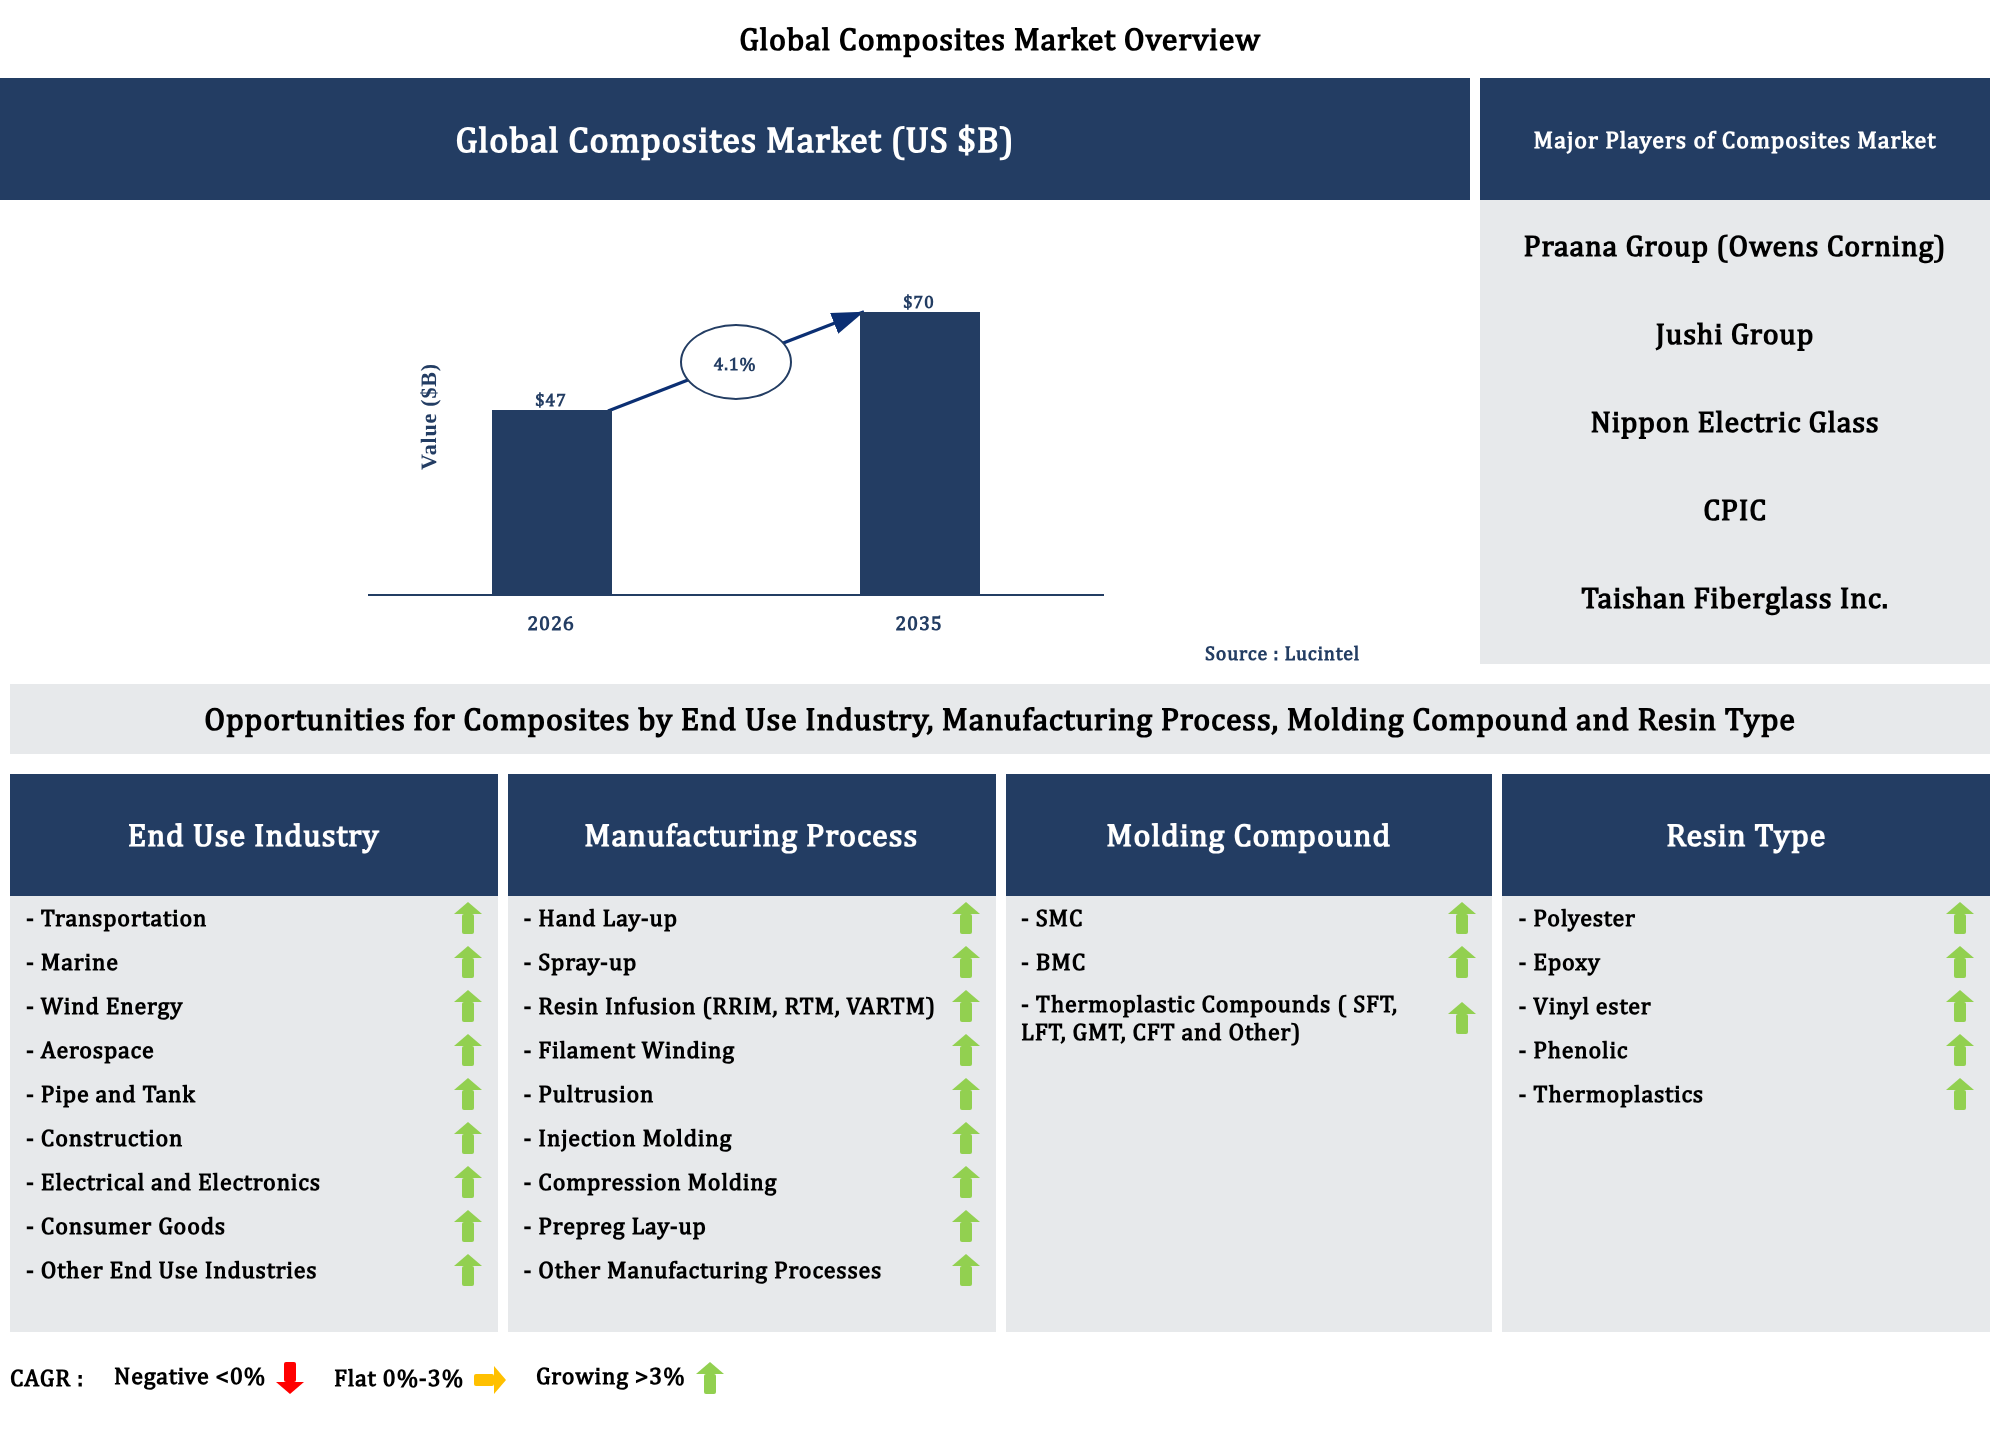
Key data points: The market size in 2035 = $70 billion, growth forecast = 4.1% annually for the next 9 years. Scroll below to get more insights. This market report covers trends, opportunities, and forecasts in the global composites market to 2035 by end use industry (transportation, marine, wind energy, aerospace, pipe and tank, construction, electrical and electronics, consumer goods and other end use industries), manufacturing process (hand lay-up, spray-up, resin infusion (rrim, rtm, vartm), filament winding, pultrusion, injection molding, compression molding, prepreg lay-up and other manufacturing processes), molding compound (smc, bmc and thermoplastic compounds ( sft, lft, gmt, cft and other)), resin type (polyester, epoxy, vinyl ester, phenolic and thermoplastics), fiber type (glass fiber, carbon fiber and aramid fiber), fiber glass product form (single end roving, multi end roving, ducs, continuous filament mat and yarn), carbon fiber type (pan based carbon fiber and pitch based carbon fiber), and region (North America, Europe, Asia Pacific, and the Rest of the World)

Publisher: Lucintel Last Updated: June 2026
See Pricing

Download Sample Report

| ✨ New Download Sample report — Get instant insights! | ✨ New Download Sample report — Get instant insights!

Composites Market Report: Trends, Forecast and Competitive Analysis to 2035

Composites Market

The future of the global composites market looks promising with opportunities in the pan based carbon fiber and pitch based carbon fiber markets. The global composites market is expected to reach an estimated $70 billion by 2035 with a CAGR of 4.1% from 2026 to 2035. The major drivers for this market are growing demand in automotive and aerospace sectors for lightweight, high-strength materials drives composites adoption to improve fuel efficiency and reduce emissions, expansion in construction, wind energy, and marine sectors boosts composites use due to corrosion resistance, durability, and long service life and innovations in resin systems, fiber reinforcement, and processes like injection molding and automated layup enhance performance, reduce costs, and expand composites applications.

  • Lucintel forecasts that, within the end use industry category, transportation will remain the largest segment over the forecast period as growing demand for lightweight, fuel-efficient, and low emission vehicles is driving composite adoption in transportation. Composites reduce vehicle weight, improve performance to meet stringent emission regulations.
  • Within the carbon fiber type category, pan based carbon fiber will remain the largest segment due to the demand for ultra-lightweight, high-strength materials is driving PAN based carbon fiber growth due to its superior stiffness, fatigue resistance, and high performance-to-weight ratio.
  • In terms of regions, APAC will remain the largest region over the forecast period due to the APAC is the growing region due to rapid industrialization, expanding automotive and aerospace production, large-scale infrastructure investments, and increasing demand for lightweight, durable, and energy-efficient materials.

Gain valuable insights for your business decisions with our comprehensive 150+ page report.
Composites Market

Emerging Trends in the Composites Market

The composites market is evolving rapidly as manufacturers, end users, and regulators seek lighter, stronger, and more sustainable materials across industries. Aerospace, automotive, construction, wind energy, and consumer goods are increasingly specifying advanced composites to meet performance and emissions targets that metals and traditional plastics struggle to achieve. At the same time, digital manufacturing, automation, and new chemistries are reshaping how composites are designed, produced, and recycled. These dynamics are giving rise to new business models, supply chains, and standards. The following emerging trends capture how the composites market is transforming to meet future technical and environmental demands.
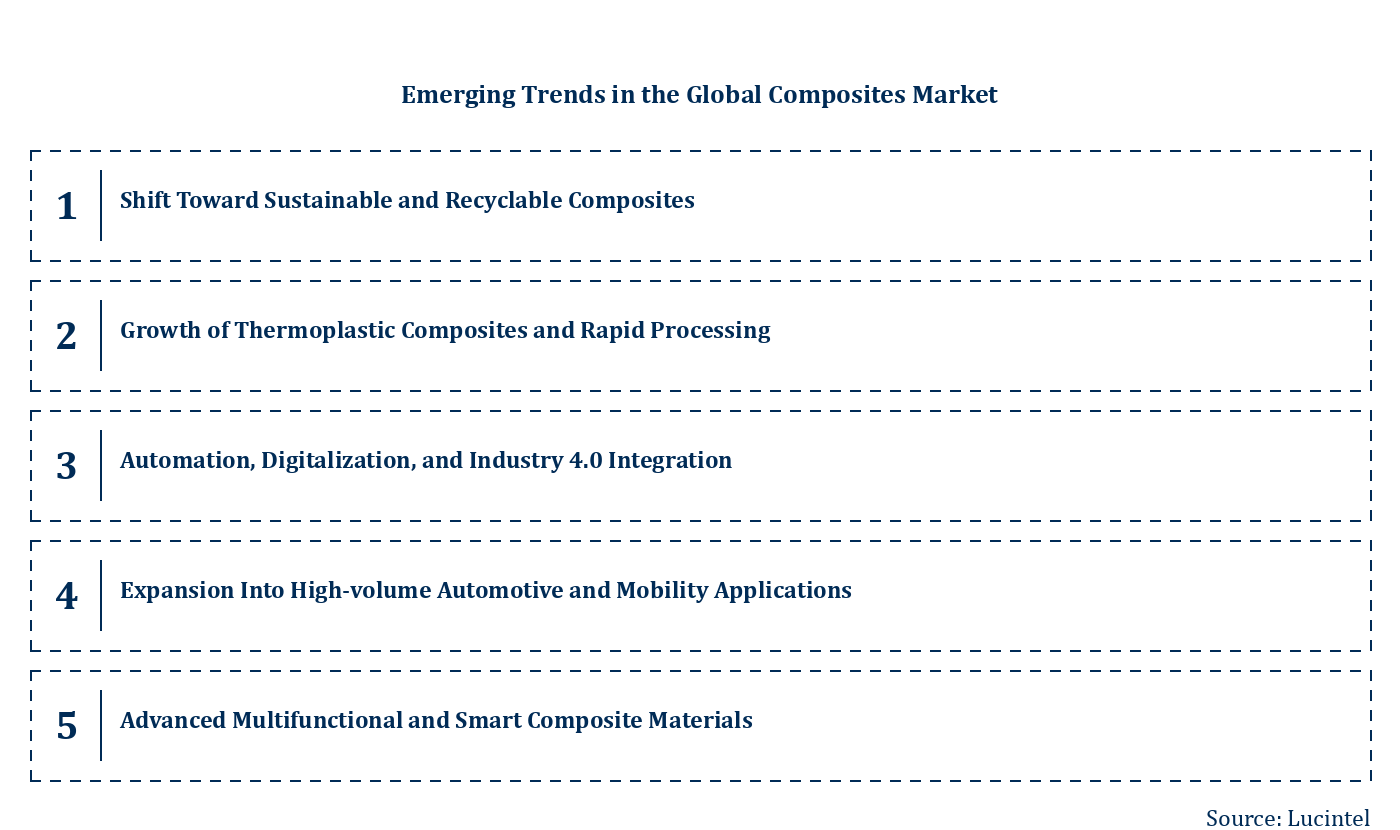
  • Shift Toward Sustainable and Recyclable Composites: The composites market is rapidly adopting bio-based resins, natural fibers, and recyclable thermoplastic matrices to reduce environmental impact and comply with tightening regulations. Manufacturers are investing in fiber reclamation, chemical recycling, and closed-loop production models to address end-of-life challenges that have historically limited composites in high-volume sectors. This trend is enabling more sustainable lightweighting in automotive, consumer goods, and building materials, while helping brands meet lifecycle carbon targets. As sustainability becomes a key purchasing criterion, greener composite solutions are moving from niche applications to mainstream specifications.
  • Growth of Thermoplastic Composites and Rapid Processing: Thermoplastic composites are gaining momentum due to their faster cycle times, weldability, and improved recyclability compared with traditional thermoset systems. Advances in high-performance thermoplastics, such as PEEK and PPS, combined with continuous fiber reinforcement, are enabling structural parts that can be formed, reshaped, and efficiently assembled. Automated processes like stamp forming, overmolding, and in-situ consolidation support higher production volumes and lower labor costs. This trend is particularly impactful in automotive and aerospace, where OEMs seek to combine lightweighting with manufacturability and repairability, driving broader adoption of thermoplastic composite technologies.
  • Automation, Digitalization, and Industry 4.0 Integration: The composites market is embracing automation, robotics, and digital tools to reduce variability, labor intensity, and scrap rates. Technologies such as automated fiber placement, robotic layup, and digital twin simulations are improving precision and repeatability in complex structures. Sensor-enabled molds, process monitoring, and data analytics support real-time quality control and predictive maintenance. This trend is critical for scaling composite production in cost-sensitive industries, enabling more consistent performance and faster development cycles. By integrating Industry 4.0 principles, producers are building smarter factories that can adapt quickly to design changes and customer-specific requirements.
  • Expansion Into High-volume Automotive and Mobility Applications: Composites are moving beyond niche and luxury vehicles into higher-volume automotive and mobility platforms, driven by electrification and stricter emissions norms. Lightweight composite structures for battery enclosures, body-in-white components, and structural reinforcements help extend range and improve safety in electric vehicles. Standardized material systems, modular designs, and faster curing technologies are reducing costs and cycle times, making composites more competitive with steel and aluminum. This trend is also extending to buses, trucks, rail, and micromobility, where weight reduction directly influences energy efficiency, payload capacity, and total cost of ownership.
  • Advanced Multifunctional and Smart Composite Materials: The composites market is increasingly focused on multifunctional materials that combine structural performance with additional capabilities such as sensing, energy storage, and thermal management. Integration of embedded sensors, conductive fibers, and nanomaterials enables self-monitoring structures that can detect damage, measure strain, or manage heat. Researchers are developing structural batteries and supercapacitor composites that can both bear loads and store energy, which is attractive for aerospace and electric vehicles. This trend is expanding the value proposition of composites beyond simple weight savings, enabling new designs, predictive maintenance strategies, and system-level performance improvements.

Composites Market by country

Recent Developments in the Composites Market

The composites market is undergoing a period of accelerated change as manufacturers, end‑use industries, and technology providers pursue lighter, stronger, and more sustainable materials. Advances in resin chemistries, fiber architectures, and automated manufacturing are expanding the performance envelope of composites while lowering production costs and cycle times. At the same time, regulatory pressure and customer expectations are pushing the value chain toward recyclability and reduced carbon footprints. Strategic partnerships, mergers, and capacity expansions are reshaping competitive dynamics across aerospace, automotive, wind energy, construction, and consumer goods. These recent developments are redefining how and where composites are designed, produced, and applied.

  • Breakthroughs in High-performance Thermoplastic Composites: The composites market has seen rapid progress in thermoplastic matrices that offer higher toughness, weldability, and faster processing than traditional thermosets. New PEEK, PEKK, and PPS systems, combined with continuous carbon fiber, enable lighter components with improved impact resistance and recyclability. These materials are gaining traction in aerospace brackets, automotive structural parts, and industrial equipment. Their ability to be reheated and reshaped supports more efficient manufacturing, repair, and end‑of‑life recovery, which is driving broader adoption and encouraging OEMs to redesign platforms around thermoplastic composite solutions.
  • Expansion of Automated and Digital Composite Manufacturing: Automation technologies such as automated fiber placement, automated tape laying, and robotic infusion are being widely implemented across the composites market to reduce labor intensity and variability. Coupled with digital twins, in‑line sensing, and advanced process controls, manufacturers are achieving better repeatability, shorter cycle times, and higher material utilization. This shift is particularly impactful in aerospace and wind energy, where large, complex structures benefit from precise layup and curing. The result is improved quality assurance, lower scrap rates, and stronger business cases for composites in high‑volume and large‑format applications.
  • Growth of Sustainable and Bio-based Composite Materials: Sustainability has become a central development theme in the composites market, with rising use of bio‑based resins, natural fibers, and low‑VOC chemistries. Flax, hemp, and other plant fibers are being engineered for higher consistency and compatibility with polymer matrices, enabling eco‑designed components in automotive interiors, sports equipment, and building products. In parallel, resin suppliers are commercializing bio‑content epoxies and recycled feedstocks. These innovations reduce reliance on fossil‑based inputs and lower lifecycle emissions, helping manufacturers and brands meet regulatory requirements and corporate sustainability targets while differentiating products in environmentally conscious market segments.
  • Advancements in Recycling and Circularity Solutions: A major recent development in the composites market is the emergence of scalable recycling technologies for both thermoset and thermoplastic systems. Companies are piloting mechanical grinding, solvolysis, and pyrolysis processes to recover fibers and resins from end‑of‑life blades, aircraft parts, and automotive components. Recovered fibers are being reintroduced into non‑critical applications such as panels, profiles, and reinforcement mats. These efforts are supported by new collection networks, design‑for‑recycling guidelines, and collaborations between OEMs, waste managers, and materials suppliers, collectively laying the groundwork for a more circular composites value chain with reduced landfill dependence.
  • Increasing Cross-industry Collaborations and Capacity Expansions: The composites market is witnessing intensified collaboration among material suppliers, OEMs, tier suppliers, and research institutions to accelerate innovation and commercialization. Joint development programs are targeting multi‑material structures, faster curing systems, and standardized qualification pathways. At the same time, producers are investing in new carbon fiber lines, resin plants, and dedicated composite component facilities, often located close to key customers in aerospace, wind, and automotive. These capacity expansions and partnerships are reducing supply bottlenecks, shortening development cycles, and enabling the scale necessary for composites to penetrate mass‑market applications and new geographic regions.

Strategic Growth Opportunities in the Composites Market

The composites market is undergoing robust strategic growth as material innovations, sustainability pressures, and performance demands converge across multiple end-use applications. Advanced composites are increasingly favored for their superior strength-to-weight ratios, corrosion resistance, design flexibility, and lifecycle cost advantages. As manufacturers seek to decarbonize operations and enhance product performance, demand for high-value composite solutions is accelerating in transportation, energy, construction, electronics, and consumer goods. These trends are reshaping value chains, catalyzing investments in automation, recycling, and digital design tools. Companies that align portfolios and partnerships with the most dynamic application segments can unlock outsized growth and long-term competitive differentiation.

  • Automotive and Transportation Lightweighting: Lightweight composite structures in automotive and transportation are a key growth engine as OEMs target stricter emissions standards and extended range in electric vehicles. Composites enable body-in-white, chassis, and interior components that reduce mass while maintaining crashworthiness and durability. Growth stems from expanded use in battery enclosures, leaf springs, and semi-structural parts, alongside process innovations such as high-pressure resin transfer molding for higher production volumes. Strategic partnerships between material suppliers, Tier 1s, and automakers will determine who captures value as design platforms transition from metals to multi-material architectures.
  • Aerospace and Defense Performance Structures: In aerospace and defense, advanced composites are central to improving fuel efficiency, range, and payload capacity while meeting stringent safety and certification requirements. Growth opportunities span primary structures such as wings, fuselages, and tail sections, as well as interior components and engine nacelles. The shift toward next-generation commercial aircraft and urban air mobility platforms further amplifies demand for high-temperature and damage-tolerant composites. Suppliers that invest in automated fiber placement, out-of-autoclave processing, and digital engineering tools can scale production, lower costs, and secure long-term supply agreements with leading airframe and defense contractors.
  • Renewable Energy and Wind Turbines: Renewable energy, particularly wind turbines, represents a major strategic growth pillar as countries accelerate decarbonization targets and deploy larger onshore and offshore installations. Composites are essential for ultra-long blades, nacelle covers, and structural components that withstand fatigue, harsh marine environments, and extreme weather. Demand intensifies with the move toward 15 MW-plus offshore turbines, which require novel resin systems, high-stiffness fibers, and optimized layup designs. Companies that develop recyclable or low-footprint composite systems and invest in localized manufacturing near wind farm clusters can gain competitive and regulatory advantages.
  • Construction and Infrastructure Modernization: In construction and infrastructure, composites open growth avenues in corrosion-resistant rebar, bridge decks, façade systems, and strengthening applications for aging assets. Their light weight and durability reduce maintenance costs and enable faster installation, especially in challenging or remote environments. Governments and asset owners are increasingly considering lifecycle cost rather than only upfront expenditure, favoring composite solutions for bridges, water systems, and coastal defenses. Standardization, design codes, and demonstrator projects are critical enablers, creating an opportunity for early movers to shape specifications and capture long-term refurbishment and new-build demand.
  • Electrical, Electronics, and Consumer Applications: Electrical, electronics, and consumer applications provide diversified growth through high-volume demand for composite housings, printed circuit substrates, insulation, and structural parts in appliances and devices. Composites deliver flame retardancy, dimensional stability, and design freedom needed for compact, high-performance electronics and smart devices. As 5G, IoT, and wearables proliferate, thermally conductive and electromagnetically shielding composite materials gain importance. Brands seeking differentiation in aesthetics and sustainability are also turning to bio-based and recycled-fiber composites. Players that balance performance, cost, and eco-profile can penetrate large OEM supply chains and achieve scale efficiently.

Composites Market Drivers and Challenges

The global composites market is shaped by a multifaceted combination of technological progress, shifting end‑use demand, cost dynamics, and evolving regulatory and sustainability expectations. Advancements in fiber reinforcement, resin chemistries, and manufacturing processes are expanding performance capabilities and lowering lifecycle costs, which encourages broader adoption across aerospace, automotive, energy, and construction. At the same time, market growth is influenced by macroeconomic cycles, raw material price volatility, and the need to meet stricter environmental standards. Understanding these drivers and challenges is essential for producers, fabricators, and end users seeking to optimize design choices, supply chains, and investment strategies in the composites ecosystem.

The factors responsible for driving the composites market include:

  • Lightweighting and Performance Demands: Growing emphasis on fuel efficiency, emissions reduction, and enhanced structural performance in transportation and aerospace is a primary driver for composites adoption. Carbon fiber and advanced glass fiber composites offer high strength‑to‑weight ratios, corrosion resistance, and design flexibility that metals cannot easily match, enabling lighter vehicles and aircraft without compromising safety. This performance advantage translates into lower operating costs, extended component life, and improved payload capacity, which are highly valued by OEMs and operators. As regulations tighten and electrification accelerates, the need for lightweight, durable materials increasingly positions composites as strategic substitutes for traditional materials.
  • Expansion in Renewable Energy and Infrastructure: The accelerating deployment of wind energy, modern power grids, and resilient civil infrastructure is significantly boosting composite consumption. Large wind turbine blades rely heavily on glass and carbon fiber composites to balance stiffness, fatigue resistance, and manufacturability at ever‑increasing blade lengths. In civil engineering, composites are used for bridge decks, rebar, strengthening wraps, and corrosion‑resistant pipelines, enhancing durability and reducing maintenance. Governments and utilities seeking long‑life assets with lower lifecycle costs are turning to composite solutions, which support decarbonization goals and climate resilience. This expanding application base creates stable, long‑term demand across both developed and emerging markets.
  • Process Innovations and Automation: Technological progress in manufacturing processes such as resin transfer molding, automated fiber placement, pultrusion, and out‑of‑autoclave curing is reducing cycle times and improving quality consistency. These innovations lower production costs and enable higher throughput, which makes composites more competitive in high‑volume industries like automotive and consumer goods. Digital tools including simulation, digital twins, and in‑line monitoring further optimize layup, curing, and defect detection, reducing scrap rates and rework. As automation improves labor productivity and repeatability, more manufacturers are willing to invest in composite technologies, supporting broader industrial adoption and enabling new design possibilities that were previously uneconomical.
  • Design Flexibility and Functional Integration: Composites offer unique design freedom that allows engineers to optimize fiber orientation, thickness, and geometry for specific load paths and performance requirements. This capability supports part consolidation, where multiple metal components and fasteners can be integrated into a single molded composite structure, reducing weight, assembly time, and potential failure points. Additionally, composites enable the integration of functionalities such as thermal insulation, impact resistance, and electromagnetic transparency in one material system. These attributes are attractive for sectors ranging from aerospace interiors to sporting goods and electronics, where differentiation, aesthetics, and performance are critical to product success and brand positioning.

The challenges in the composites market are:

  • High Material and Processing Costs: Despite performance benefits, many composite systems remain more expensive than conventional materials when evaluated on an upfront cost basis. Carbon fibers, specialty resins, and precision tooling contribute to elevated material and capital expenditures, while complex layup and curing processes can be labor intensive. For cost‑sensitive segments such as mass‑market automotive or construction, these economics can limit adoption, especially when total cost of ownership is not fully recognized by buyers. Manufacturers must continually balance performance targets with affordability and are pressured to optimize formulations, supply sources, and process efficiencies to close the cost gap with metals and other alternatives.
  • Recycling, Sustainability, and Regulatory Pressure: End‑of‑life management of thermoset composites and fiber‑reinforced structures remains a persistent challenge, drawing increasing scrutiny from regulators, customers, and environmental stakeholders. Many composite components are difficult to recycle economically at scale, leading to landfill or energy recovery routes that may not align with circular economy goals. Stricter environmental regulations and corporate sustainability commitments are forcing the industry to invest in recyclable resin systems, closed‑loop processes, and advanced recycling technologies. However, these solutions are still maturing and can involve higher costs or performance trade‑offs, creating uncertainty and potential barriers for long‑term project approvals and public acceptance.
  • Design Complexity, Standardization, and Skills Gap: Engineering with composites requires specialized knowledge of anisotropic behavior, failure modes, and processing‑structure‑property relationships, which differs markedly from metals. The limited availability of standardized design codes, testing protocols, and broadly accepted material databases can slow qualification, certification, and regulatory approval, particularly in safety‑critical industries such as aerospace, automotive, and construction. Moreover, there is a shortage of experienced composite engineers, technicians, and production staff, which constrains capacity and increases labor costs. Companies must invest heavily in training, simulation tools, and collaborative development with customers to mitigate these barriers, extending development timelines and raising entry thresholds for new market participants.

The global composites market is being propelled by the need for lightweight, high‑performance materials, expanding renewable energy and infrastructure investments, rapid process innovation, and unique design flexibility that enables functional integration. At the same time, widespread adoption is tempered by elevated costs, recycling and sustainability constraints, and the complexity of design, standardization, and talent requirements. These opposing forces create a dynamic landscape where value is unlocked by companies that can demonstrate compelling lifecycle economics, develop sustainable material systems, and streamline engineering and certification. Stakeholders that successfully navigate these drivers and challenges are positioned to capture outsized growth as composites move further into mainstream applications.

List of Composites Market Companies

Companies in the market compete on the basis of product quality offered. Major players in this market focus on expanding their manufacturing facilities, R&D investments, infrastructural development, and leverage integration opportunities across the value chain. Through these strategies composites market companies cater increasing demand, ensure competitive effectiveness, develop innovative products & technologies, reduce production costs, and expand their customer base. Some of the composites market companies profiled in this report include-

  • Praana Group (Owens Corning)
  • Jushi Group
  • Nippon Electric Glass
  • CPIC
  • Taishan Fiberglass Inc.
  • Toray Industries Inc.
  • Hexcel Corporation
  • Mitsubishi Chemical Group
  • Syensqo
  • SGL Carbon
  • Teijin Limited
  • DuPont
  • Polynt Group
  • INEOS Composites (KPS Capital Partners)
  • AOC (Nippon Paint Holdings)
  • Boeing
  • Airbus
  • Honeywell
  • Trek
  • General Motors Corporation

Composites Market by Segment

The study includes a forecast for the global composites market by end use industry, manufacturing process, molding compound, resin type, fiber type, fiber glass product form, carbon fiber type, and region.

  • Composites Market by End Use Industry [Value ($B) and Volume (Million Pounds) from 2019 to 2035]:
    • Transportation
    • Marine
    • Wind Energy
    • Aerospace
    • Pipe and Tank
    • Construction
    • Electrical and Electronics
    • Consumer Goods
    • Other End Use Industries
  • Composites Market by Manufacturing Process [Value ($B) and Volume (Million Pounds) from 2019 to 2035]:
    • Hand Lay-up
    • Spray-up
    • Resin Infusion (RRIM, RTM, VARTM)
    • Filament Winding
    • Pultrusion
    • Injection Molding
    • Compression Molding
    • Prepreg Lay-up
    • Other Manufacturing Processes
  • Composites Market by Molding Compound [Value ($B) and Volume (Million Pounds) from 2019 to 2035]:
    • SMC
    • BMC
    • Thermoplastic Compounds ( SFT, LFT, GMT, CFT and Other)
  • Composites Market by Resin Type [Value ($B) and Volume (Million Pounds) from 2019 to 2035]:
    • Polyester
    • Epoxy
    • Vinyl ester
    • Phenolic
    • Thermoplastics
  • Composites Market by Fiber Type [Value ($B) and Volume (Million Pounds) from 2019 to 2035]:
    • Glass Fiber
    • Carbon Fiber
    • Aramid Fiber
  • Composites Market by Fiber Glass Product Form [Value ($B) and Volume (Million Pounds) from 2019 to 2035]:
    • Single End Roving
    • Multi End Roving
    • DUCs
    • Continuous Filament Mat
    • Yarn
  • Composites Market by Carbon Fiber Type [Value ($B) and Volume (Million Pounds) from 2019 to 2035]:
    • PAN Based Carbon Fiber
    • PITCH Based Carbon Fiber
  • Composites Market by Region [Value ($B) and Volume (Million Pounds) from 2019 to 2035]:
    • North America
    • Europe
    • Asia Pacific
    • The Rest of the World

Country Wise Outlook for the Composites Market

The global composites market is undergoing rapid transformation as industries seek lightweight, high‑strength, and corrosion‑resistant materials to improve performance and reduce emissions. Advances in carbon fiber, glass fiber, and natural fiber composites are reshaping applications across aerospace, automotive, construction, renewable energy, and electronics. Automation in manufacturing, recycling technologies, and tougher regulatory standards on sustainability are driving innovation. Each major economy is pursuing its own strategy, balancing domestic supply chains, technological leadership, and climate goals. Recent developments in the United States, China, Germany, India, and Japan illustrate how composite materials are becoming central to industrial competitiveness and energy transition.

  • United States: The United States composites market is seeing strong momentum from aerospace, defense, and electric vehicle programs that demand lightweight structures and improved fuel efficiency. Major advances include higher-rate automated fiber placement, thermoplastic composites for faster processing, and expanded use of carbon fiber in hydrogen storage tanks and wind blades. Federal and state incentives for clean energy are boosting demand for composite-intensive wind and solar infrastructure. At the same time, U.S. manufacturers and research institutes are investing in recycling of carbon fiber composites and bio-based resins to address end-of-life challenges and reduce dependence on imported materials.
  • China: China’s composites market is expanding quickly, supported by large-scale infrastructure projects, high-speed rail, and energy transition initiatives. The country is ramping up domestic production of carbon fiber and glass fiber to reduce reliance on imports and secure critical materials for wind turbines, aerospace, and new energy vehicles. Government-backed programs encourage localization of advanced composite processing technologies, including automated molding and resin transfer systems. Chinese firms are also integrating composites into 5G base stations, consumer electronics, and urban construction. Environmental regulations and “dual carbon” goals are pushing development of recyclable thermoplastic composites and low-emission resin systems.
  • Germany: Germany’s composites market development is closely tied to its automotive and industrial engineering strengths, with a strong focus on lightweighting for electric vehicles and advanced machinery. German OEMs and Tier 1 suppliers are refining hybrid structures that combine metals with carbon and glass fiber composites for optimal cost and performance. Significant activity is occurring in high-pressure resin transfer molding, automated tape laying, and digital twins for composite component design. Publicly funded clusters and EU programs support innovation in recyclable composites and life-cycle assessment. In wind energy and building applications, German players emphasize durability, fire performance, and circularity of composite solutions.
  • India: India’s composites market is evolving rapidly, with demand rising from renewable energy, transportation, and infrastructure sectors. The expansion of domestic wind power capacity is a key driver, increasing the need for large composite blades and related structural components. Indian manufacturers are investing in low-cost, high-volume glass fiber composites for pipes, tanks, and construction products, while gradually moving into carbon fiber applications for rail, aerospace, and defense. Government initiatives promoting manufacturing and localization are encouraging technology transfers and joint ventures. There is growing interest in natural fiber composites using jute, coir, and bamboo to create sustainable, affordable materials tailored to local conditions.
  • Japan: Japan’s composites market is characterized by high-performance applications in aerospace, automotive, robotics, and electronics, with a strong emphasis on precision and reliability. Japanese companies are leading developments in advanced carbon fiber, high-modulus prepregs, and thermoplastic composites suited for mass-produced automotive parts and next-generation aircraft. Robotics and factory automation use composite components to reduce weight and improve dynamic performance. Material suppliers collaborate closely with automakers and electronics firms to create multifunctional composites with built-in sensing or thermal management capabilities. Japan is also investing in recycling technologies and low-volatile organic compound resin systems to meet strict environmental and workplace safety standards.

Features of the Composites Market

  • Market Size Estimates: Composites market size estimation in terms of value ($B).
  • Trend and Forecast Analysis: Market trends (2019 to 2025) and forecast (2026 to 2035) by various segments and regions.
  • Segmentation Analysis: Composites market size by various segments, such as by end use industry, manufacturing process, molding compound, resin type, fiber type, fiber glass product form, carbon fiber type and region in terms of value ($B).
  • Regional Analysis: Composites market breakdown by North America, Europe, Asia Pacific, and the Rest of the World.
  • Growth Opportunities: Analysis of growth opportunities in different end use industry, manufacturing process, molding compound, resin type, fiber type, fiber glass product form, carbon fiber type and regions for the composites market.
  • Strategic Analysis: This includes M&A, new product development, and competitive landscape of the composites market.
  • Analysis of competitive intensity of the industry based on Porter's Five Forces model.

Top 5 Companies

• Praana Group (Owens Corning)

• Jushi Group

• Nippon Electric Glass

• CPIC

• Taishan Fiberglass Inc.

Table of Contents

1. Executive Summary
18.1 Competitive Analysis

List of Figures

Figure 12.1: Trends and Forecast for the North America Composites Market in (2019-2035) Figure 12.2: North America Composites Market by End Use Industry in 2019, 2025, and 2035 Figure 12.3: Trends of the North America Composites Market ($B) by End Use Industry (2019-2025) Figure 12.4: Forecast for the North America Composites Market ($B) by End Use Industry (2026-2035) Figure 12.5: Trends of the North America Composites Market (Million Pounds) by End Use Industry (2019-2025) Figure 12.6: Forecast for the North America Composites Market (Million Pounds) by End Use Industry (2026-2035) Figure 12.7: North America Composites Market by Manufacturing Process in 2019, 2025, and 2035 Figure 12.8: Trends of the North America Composites Market ($B) by Manufacturing Process (2019-2025) Figure 12.9: Forecast for the North America Composites Market ($B) by Manufacturing Process (2026-2035) Figure 12.10: Trends of the North America Composites Market (Million Pounds) by Manufacturing Process (2019-2025) Figure 12.11: Forecast for the North America Composites Market (Million Pounds) by Manufacturing Process (2026-2035) Figure 12.12: North America Composites Market by Molding Compound in 2019, 2025, and 2035 Figure 12.13: Trends of the North America Composites Market ($B) by Molding Compound (2019-2025) Figure 12.14: Forecast for the North America Composites Market ($B) by Molding Compound (2026-2035) Figure 12.15: Trends of the North America Composites Market (Million Pounds) by Molding Compound (2019-2025) Figure 12.16: Forecast for the North America Composites Market (Million Pounds) by Molding Compound (2026-2035) Figure 12.17: North America Composites Market by Resin Type in 2019, 2025, and 2035 Figure 12.18: Trends of the North America Composites Market ($B) by Resin Type (2019-2025) Figure 12.19: Forecast for the North America Composites Market ($B) by Resin Type (2026-2035) Figure 12.20: Trends of the North America Composites Market (Million Pounds) by Resin Type (2019-2025) Figure 12.21: Forecast for the North America Composites Market (Million Pounds) by Resin Type (2026-2035) Figure 12.22: North America Composites Market by Fiber Type in 2019, 2025, and 2035 Figure 12.23: Trends of the North America Composites Market ($B) by Fiber Type (2019-2025) Figure 12.24: Forecast for the North America Composites Market ($B) by Fiber Type (2026-2035) Figure 12.25: Trends of the North America Composites Market (Million Pounds) by Fiber Type (2019-2025) Figure 12.26: Forecast for the North America Composites Market (Million Pounds) by Fiber Type (2026-2035) Figure 12.27: North America Composites Market by Fiber Glass Product Form in 2019, 2025, and 2035 Figure 12.28: Trends of the North America Composites Market ($B) by Fiber Glass Product Form (2019-2025) Figure 12.29: Forecast for the North America Composites Market ($B) by Fiber Glass Product Form (2026-2035) Figure 12.30: Trends of the North America Composites Market (Million Pounds) by Fiber Glass Product Form (2019-2025) Figure 12.31: Forecast for the North America Composites Market (Million Pounds) by Fiber Glass Product Form (2026-2035) Figure 12.32: North America Composites Market by Carbon Fiber Type in 2019, 2025, and 2035 Figure 12.33: Trends of the North America Composites Market ($B) by Carbon Fiber Type (2019-2025) Figure 12.34: Forecast for the North America Composites Market ($B) by Carbon Fiber Type (2026-2035) Figure 12.35: Trends of the North America Composites Market (Million Pounds) by Carbon Fiber Type (2019-2025) Figure 12.36: Forecast for the North America Composites Market (Million Pounds) by Carbon Fiber Type (2026-2035) Figure 12.37: Trends and Forecast for the Canada Composites Market ($B) (2019-2035) Figure 12.38: Trends and Forecast for the United States Composites Market ($B) (2019-2035) Figure 12.39: Trends and Forecast for the Mexico Composites Market ($B) (2019-2035)
Figure 13.1: Trends and Forecast for the Europe Composites Market in (2019-2035) Figure 13.2: Europe Composites Market by End Use Industry in 2019, 2025, and 2035 Figure 13.3: Trends of the Europe Composites Market ($B) by End Use Industry (2019-2025) Figure 13.4: Forecast for the Europe Composites Market ($B) by End Use Industry (2026-2035) Figure 13.5: Trends of the Europe Composites Market (Million Pounds) by End Use Industry (2019-2025) Figure 13.6: Forecast for the Europe Composites Market (Million Pounds) by End Use Industry (2026-2035) Figure 13.7: Europe Composites Market by Manufacturing Process in 2019, 2025, and 2035 Figure 13.8: Trends of the Europe Composites Market ($B) by Manufacturing Process (2019-2025) Figure 13.9: Forecast for the Europe Composites Market ($B) by Manufacturing Process (2026-2035) Figure 13.10: Trends of the Europe Composites Market (Million Pounds) by Manufacturing Process (2019-2025) Figure 13.11: Forecast for the Europe Composites Market (Million Pounds) by Manufacturing Process (2026-2035) Figure 13.12: Europe Composites Market by Molding Compound in 2019, 2025, and 2035 Figure 13.13: Trends of the Europe Composites Market ($B) by Molding Compound (2019-2025) Figure 13.14: Forecast for the Europe Composites Market ($B) by Molding Compound (2026-2035) Figure 13.15: Trends of the Europe Composites Market (Million Pounds) by Molding Compound (2019-2025) Figure 13.16: Forecast for the Europe Composites Market (Million Pounds) by Molding Compound (2026-2035) Figure 13.17: Europe Composites Market by Resin Type in 2019, 2025, and 2035 Figure 13.18: Trends of the Europe Composites Market ($B) by Resin Type (2019-2025) Figure 13.19: Forecast for the Europe Composites Market ($B) by Resin Type (2026-2035) Figure 13.20: Trends of the Europe Composites Market (Million Pounds) by Resin Type (2019-2025) Figure 13.21: Forecast for the Europe Composites Market (Million Pounds) by Resin Type (2026-2035) Figure 13.22: Europe Composites Market by Fiber Type in 2019, 2025, and 2035 Figure 13.23: Trends of the Europe Composites Market ($B) by Fiber Type (2019-2025) Figure 13.24: Forecast for the Europe Composites Market ($B) by Fiber Type (2026-2035) Figure 13.25: Trends of the Europe Composites Market (Million Pounds) by Fiber Type (2019-2025) Figure 13.26: Forecast for the Europe Composites Market (Million Pounds) by Fiber Type (2026-2035) Figure 13.27: Europe Composites Market by Fiber Glass Product Form in 2019, 2025, and 2035 Figure 13.28: Trends of the Europe Composites Market ($B) by Fiber Glass Product Form (2019-2025) Figure 13.29: Forecast for the Europe Composites Market ($B) by Fiber Glass Product Form (2026-2035) Figure 13.30: Trends of the Europe Composites Market (Million Pounds) by Fiber Glass Product Form (2019-2025) Figure 13.31: Forecast for the Europe Composites Market (Million Pounds) by Fiber Glass Product Form (2026-2035) Figure 13.32: Europe Composites Market by Carbon Fiber Type in 2019, 2025, and 2035 Figure 13.33: Trends of the Europe Composites Market ($B) by Carbon Fiber Type (2019-2025) Figure 13.34: Forecast for the Europe Composites Market ($B) by Carbon Fiber Type (2026-2035) Figure 13.35: Trends of the Europe Composites Market (Million Pounds) by Carbon Fiber Type (2019-2025) Figure 13.36: Forecast for the Europe Composites Market (Million Pounds) by Carbon Fiber Type (2026-2035) Figure 13.37: Trends and Forecast for the Germany Composites Market ($B) (2019-2035) Figure 13.38: Trends and Forecast for the France Composites Market ($B) (2019-2035) Figure 13.39: Trends and Forecast for the Italy Composites Market ($B) (2019-2035) Figure 13.40: Trends and Forecast for the United Kingdom Composites Market ($B) (2019-2035) Figure 13.41: Trends and Forecast for the Spain Composites Market ($B) (2019-2035) Figure 13.42: Trends and Forecast for the Netherlands Composites Market ($B) (2019-2035)
Figure 14.1: Trends and Forecast for the APAC Composites Market in (2019-2035) Figure 14.2: APAC Composites Market by End Use Industry in 2019, 2025, and 2035 Figure 14.3: Trends of the APAC Composites Market ($B) by End Use Industry (2019-2025) Figure 14.4: Forecast for the APAC Composites Market ($B) by End Use Industry (2026-2035) Figure 14.5: Trends of the APAC Composites Market (Million Pounds) by End Use Industry (2019-2025) Figure 14.6: Forecast for the APAC Composites Market (Million Pounds) by End Use Industry (2026-2035) Figure 14.7: APAC Composites Market by Manufacturing Process in 2019, 2025, and 2035 Figure 14.8: Trends of the APAC Composites Market ($B) by Manufacturing Process (2019-2025) Figure 14.9: Forecast for the APAC Composites Market ($B) by Manufacturing Process (2026-2035) Figure 14.10: Trends of the APAC Composites Market (Million Pounds) by Manufacturing Process (2019-2025) Figure 14.11: Forecast for the APAC Composites Market (Million Pounds) by Manufacturing Process (2026-2035) Figure 14.12: APAC Composites Market by Molding Compound in 2019, 2025, and 2035 Figure 14.13: Trends of the APAC Composites Market ($B) by Molding Compound (2019-2025) Figure 14.14: Forecast for the APAC Composites Market ($B) by Molding Compound (2026-2035) Figure 14.15: Trends of the APAC Composites Market (Million Pounds) by Molding Compound (2019-2025) Figure 14.16: Forecast for the APAC Composites Market (Million Pounds) by Molding Compound (2026-2035) Figure 14.17: APAC Composites Market by Resin Type in 2019, 2025, and 2035 Figure 14.18: Trends of the APAC Composites Market ($B) by Resin Type (2019-2025) Figure 14.19: Forecast for the APAC Composites Market ($B) by Resin Type (2026-2035) Figure 14.20: Trends of the APAC Composites Market (Million Pounds) by Resin Type (2019-2025) Figure 14.21: Forecast for the APAC Composites Market (Million Pounds) by Resin Type (2026-2035) Figure 14.22: APAC Composites Market by Fiber Type in 2019, 2025, and 2035 Figure 14.23: Trends of the APAC Composites Market ($B) by Fiber Type (2019-2025) Figure 14.24: Forecast for the APAC Composites Market ($B) by Fiber Type (2026-2035) Figure 14.25: Trends of the APAC Composites Market (Million Pounds) by Fiber Type (2019-2025) Figure 14.26: Forecast for the APAC Composites Market (Million Pounds) by Fiber Type (2026-2035) Figure 14.27: APAC Composites Market by Fiber Glass Product Form in 2019, 2025, and 2035 Figure 14.28: Trends of the APAC Composites Market ($B) by Fiber Glass Product Form (2019-2025) Figure 14.29: Forecast for the APAC Composites Market ($B) by Fiber Glass Product Form (2026-2035) Figure 14.30: Trends of the APAC Composites Market (Million Pounds) by Fiber Glass Product Form (2019-2025) Figure 14.31: Forecast for the APAC Composites Market (Million Pounds) by Fiber Glass Product Form (2026-2035) Figure 14.32: APAC Composites Market by Carbon Fiber Type in 2019, 2025, and 2035 Figure 14.33: Trends of the APAC Composites Market ($B) by Carbon Fiber Type (2019-2025) Figure 14.34: Forecast for the APAC Composites Market ($B) by Carbon Fiber Type (2026-2035) Figure 14.35: Trends of the APAC Composites Market (Million Pounds) by Carbon Fiber Type (2019-2025) Figure 14.36: Forecast for the APAC Composites Market (Million Pounds) by Carbon Fiber Type (2026-2035) Figure 14.37: Trends and Forecast for the Australia Composites Market ($B) (2019-2035) Figure 14.38: Trends and Forecast for the India Composites Market ($B) (2019-2035) Figure 14.39: Trends and Forecast for the China Composites Market ($B) (2019-2035) Figure 14.40: Trends and Forecast for the Japan Composites Market ($B) (2019-2035) Figure 14.41: Trends and Forecast for the South Korea Composites Market ($B) (2019-2035) Figure 14.42: Trends and Forecast for the Thailand Composites Market ($B) (2019-2035) Figure 14.43: Trends and Forecast for the Taiwan Composites Market ($B) (2019-2035)
Figure 15.1: Trends and Forecast for the ROW Composites Market in (2019-2035) Figure 15.2: ROW Composites Market by End Use Industry in 2019, 2025, and 2035 Figure 15.3: Trends of the ROW Composites Market ($B) by End Use Industry (2019-2025) Figure 15.4: Forecast for the ROW Composites Market ($B) by End Use Industry (2026-2035) Figure 15.5: Trends of the ROW Composites Market (Million Pounds) by End Use Industry (2019-2025) Figure 15.6: Forecast for the ROW Composites Market (Million Pounds) by End Use Industry (2026-2035) Figure 15.7: ROW Composites Market by Manufacturing Process in 2019, 2025, and 2035 Figure 15.8: Trends of the ROW Composites Market ($B) by Manufacturing Process (2019-2025) Figure 15.9: Forecast for the ROW Composites Market ($B) by Manufacturing Process (2026-2035) Figure 15.10: Trends of the ROW Composites Market (Million Pounds) by Manufacturing Process (2019-2025) Figure 15.11: Forecast for the ROW Composites Market (Million Pounds) by Manufacturing Process (2026-2035) Figure 15.12: ROW Composites Market by Molding Compound in 2019, 2025, and 2035 Figure 15.13: Trends of the ROW Composites Market ($B) by Molding Compound (2019-2025) Figure 15.14: Forecast for the ROW Composites Market ($B) by Molding Compound (2026-2035) Figure 15.15: Trends of the ROW Composites Market (Million Pounds) by Molding Compound (2019-2025) Figure 15.16: Forecast for the ROW Composites Market (Million Pounds) by Molding Compound (2026-2035) Figure 15.17: ROW Composites Market by Resin Type in 2019, 2025, and 2035 Figure 15.18: Trends of the ROW Composites Market ($B) by Resin Type (2019-2025) Figure 15.19: Forecast for the ROW Composites Market ($B) by Resin Type (2026-2035) Figure 15.20: Trends of the ROW Composites Market (Million Pounds) by Resin Type (2019-2025) Figure 15.21: Forecast for the ROW Composites Market (Million Pounds) by Resin Type (2026-2035) Figure 15.22: ROW Composites Market by Fiber Type in 2019, 2025, and 2035 Figure 15.23: Trends of the ROW Composites Market ($B) by Fiber Type (2019-2025) Figure 15.24: Forecast for the ROW Composites Market ($B) by Fiber Type (2026-2035) Figure 15.25: Trends of the ROW Composites Market (Million Pounds) by Fiber Type (2019-2025) Figure 15.26: Forecast for the ROW Composites Market (Million Pounds) by Fiber Type (2026-2035) Figure 15.27: ROW Composites Market by Fiber Glass Product Form in 2019, 2025, and 2035 Figure 15.28: Trends of the ROW Composites Market ($B) by Fiber Glass Product Form (2019-2025) Figure 15.29: Forecast for the ROW Composites Market ($B) by Fiber Glass Product Form (2026-2035) Figure 15.30: Trends of the ROW Composites Market (Million Pounds) by Fiber Glass Product Form (2019-2025) Figure 15.31: Forecast for the ROW Composites Market (Million Pounds) by Fiber Glass Product Form (2026-2035) Figure 15.32: ROW Composites Market by Carbon Fiber Type in 2019, 2025, and 2035 Figure 15.33: Trends of the ROW Composites Market ($B) by Carbon Fiber Type (2019-2025) Figure 15.34: Forecast for the ROW Composites Market ($B) by Carbon Fiber Type (2026-2035) Figure 15.35: Trends of the ROW Composites Market (Million Pounds) by Carbon Fiber Type (2019-2025) Figure 15.36: Forecast for the ROW Composites Market (Million Pounds) by Carbon Fiber Type (2026-2035) Figure 15.37: Trends and Forecast for the Brazil Composites Market ($B) (2019-2035) Figure 15.38: Trends and Forecast for the South Africa Composites Market ($B) (2019-2035)

List of Tables

Table 4.1: Attractiveness Analysis for the Global Composites Market by End Use Industry Table 4.2: Market Size and CAGR of Various End Use Industry in the Global Composites Market by Value (2019-2025) Table 4.3: Market Size and CAGR of Various End Use Industry in the Global Composites Market by Value (2026-2035) Table 4.4: Market Size and CAGR of Various End Use Industry in the Global Composites Market by Volume (2019-2025) Table 4.5: Market Size and CAGR of Various End Use Industry in the Global Composites Market by Volume (2026-2035) Table 4.6: Trends of Transportation in the Global Composites Market (2019-2025) Table 4.7: Forecast for Transportation in the Global Composites Market (2026-2035) Table 4.8: Trends of Marine in the Global Composites Market (2019-2025) Table 4.9: Forecast for Marine in the Global Composites Market (2026-2035) Table 4.10: Trends of Wind Energy in the Global Composites Market (2019-2025) Table 4.11: Forecast for Wind Energy in the Global Composites Market (2026-2035) Table 4.12: Trends of Aerospace in the Global Composites Market (2019-2025) Table 4.13: Forecast for Aerospace in the Global Composites Market (2026-2035) Table 4.14: Trends of Pipe and Tank in the Global Composites Market (2019-2025) Table 4.15: Forecast for Pipe and Tank in the Global Composites Market (2026-2035) Table 4.16: Trends of Construction in the Global Composites Market (2019-2025) Table 4.17: Forecast for Construction in the Global Composites Market (2026-2035) Table 4.18: Trends of Electrical and Electronics in the Global Composites Market (2019-2025) Table 4.19: Forecast for Electrical and Electronics in the Global Composites Market (2026-2035) Table 4.20: Trends of Consumer Goods in the Global Composites Market (2019-2025) Table 4.21: Forecast for Consumer Goods in the Global Composites Market (2026-2035) Table 4.22: Trends of Other End Use Industries in the Global Composites Market (2019-2025) Table 4.23: Forecast for Other End Use Industries in the Global Composites Market (2026-2035)
Table 5.1: Attractiveness Analysis for the Global Composites Market by Manufacturing Process Table 5.2: Market Size and CAGR of Various Manufacturing Process in the Global Composites Market by Value (2019-2025) Table 5.3: Market Size and CAGR of Various Manufacturing Process in the Global Composites Market by Value (2026-2035) Table 5.4: Market Size and CAGR of Various Manufacturing Process in the Global Composites Market by Volume (2019-2025) Table 5.5: Market Size and CAGR of Various Manufacturing Process in the Global Composites Market by Volume (2026-2035) Table 5.6: Trends of Hand Lay-up in the Global Composites Market (2019-2025) Table 5.7: Forecast for Hand Lay-up in the Global Composites Market (2026-2035) Table 5.8: Trends of Spray-up in the Global Composites Market (2019-2025) Table 5.9: Forecast for Spray-up in the Global Composites Market (2026-2035) Table 5.10: Trends of Resin Infusion (RRIM, RTM, VARTM) in the Global Composites Market (2019-2025) Table 5.11: Forecast for Resin Infusion (RRIM, RTM, VARTM) in the Global Composites Market (2026-2035) Table 5.12: Trends of Filament Winding in the Global Composites Market (2019-2025) Table 5.13: Forecast for Filament Winding in the Global Composites Market (2026-2035) Table 5.14: Trends of Pultrusion in the Global Composites Market (2019-2025) Table 5.15: Forecast for Pultrusion in the Global Composites Market (2026-2035) Table 5.16: Trends of Injection Molding in the Global Composites Market (2019-2025) Table 5.17: Forecast for Injection Molding in the Global Composites Market (2026-2035) Table 5.18: Trends of Compression Molding in the Global Composites Market (2019-2025) Table 5.19: Forecast for Compression Molding in the Global Composites Market (2026-2035) Table 5.20: Trends of Prepreg Lay-up in the Global Composites Market (2019-2025) Table 5.21: Forecast for Prepreg Lay-up in the Global Composites Market (2026-2035) Table 5.22: Trends of Other Manufacturing Processes in the Global Composites Market (2019-2025) Table 5.23: Forecast for Other Manufacturing Processes in the Global Composites Market (2026-2035)
Table 12.1: Trends of the North America Composites Market (2019-2025) Table 12.2: Forecast for the North America Composites Market (2026-2035) Table 12.3: Market Size and CAGR of Various End Use Industry in the North America Composites Market by Value (2019-2025) Table 12.4: Market Size and CAGR of Various End Use Industry in the North America Composites Market by Value (2026-2035) Table 12.5: Market Size and CAGR of Various End Use Industry in the North America Composites Market by Volume (2019-2025) Table 12.6: Market Size and CAGR of Various End Use Industry in the North America Composites Market by Volume (2026-2035) Table 12.7: Market Size and CAGR of Various Manufacturing Process in the North America Composites Market by Value (2019-2025) Table 12.8: Market Size and CAGR of Various Manufacturing Process in the North America Composites Market by Value (2026-2035) Table 12.9: Market Size and CAGR of Various Manufacturing Process in the North America Composites Market by Volume (2019-2025) Table 12.10: Market Size and CAGR of Various Manufacturing Process in the North America Composites Market by Volume (2026-2035) Table 12.11: Market Size and CAGR of Various Molding Compound in the North America Composites Market by Value (2019-2025) Table 12.12: Market Size and CAGR of Various Molding Compound in the North America Composites Market by Value (2026-2035) Table 12.13: Market Size and CAGR of Various Molding Compound in the North America Composites Market by Volume (2019-2025) Table 12.14: Market Size and CAGR of Various Molding Compound in the North America Composites Market by Volume (2026-2035) Table 12.15: Market Size and CAGR of Various Resin Type in the North America Composites Market by Value (2019-2025) Table 12.16: Market Size and CAGR of Various Resin Type in the North America Composites Market by Value (2026-2035) Table 12.17: Market Size and CAGR of Various Resin Type in the North America Composites Market by Volume (2019-2025) Table 12.18: Market Size and CAGR of Various Resin Type in the North America Composites Market by Volume (2026-2035) Table 12.19: Market Size and CAGR of Various Fiber Type in the North America Composites Market by Value (2019-2025) Table 12.20: Market Size and CAGR of Various Fiber Type in the North America Composites Market by Value (2026-2035) Table 12.21: Market Size and CAGR of Various Fiber Type in the North America Composites Market by Volume (2019-2025) Table 12.22: Market Size and CAGR of Various Fiber Type in the North America Composites Market by Volume (2026-2035) Table 12.23: Market Size and CAGR of Various Fiber Glass Product Form in the North America Composites Market by Value (2019-2025) Table 12.24: Market Size and CAGR of Various Fiber Glass Product Form in the North America Composites Market by Value (2026-2035) Table 12.25: Market Size and CAGR of Various Fiber Glass Product Form in the North America Composites Market by Volume (2019-2025) Table 12.26: Market Size and CAGR of Various Fiber Glass Product Form in the North America Composites Market by Volume (2026-2035) Table 12.27: Market Size and CAGR of Various Carbon Fiber Type in the North America Composites Market by Value (2019-2025) Table 12.28: Market Size and CAGR of Various Carbon Fiber Type in the North America Composites Market by Value (2026-2035) Table 12.29: Market Size and CAGR of Various Carbon Fiber Type in the North America Composites Market by Volume (2019-2025) Table 12.30: Market Size and CAGR of Various Carbon Fiber Type in the North America Composites Market by Volume (2026-2035) Table 12.31: Trends and Forecast for the Canada Composites Market (2019-2035) Table 12.32: Trends and Forecast for the United States Composites Market (2019-2035) Table 12.33: Trends and Forecast for the Mexico Composites Market (2019-2035)
Table 13.1: Trends of the Europe Composites Market (2019-2025) Table 13.2: Forecast for the Europe Composites Market (2026-2035) Table 13.3: Market Size and CAGR of Various End Use Industry in the Europe Composites Market by Value (2019-2025) Table 13.4: Market Size and CAGR of Various End Use Industry in the Europe Composites Market by Value (2026-2035) Table 13.5: Market Size and CAGR of Various End Use Industry in the Europe Composites Market by Volume (2019-2025) Table 13.6: Market Size and CAGR of Various End Use Industry in the Europe Composites Market by Volume (2026-2035) Table 13.7: Market Size and CAGR of Various Manufacturing Process in the Europe Composites Market by Value (2019-2025) Table 13.8: Market Size and CAGR of Various Manufacturing Process in the Europe Composites Market by Value (2026-2035) Table 13.9: Market Size and CAGR of Various Manufacturing Process in the Europe Composites Market by Volume (2019-2025) Table 13.10: Market Size and CAGR of Various Manufacturing Process in the Europe Composites Market by Volume (2026-2035) Table 13.11: Market Size and CAGR of Various Molding Compound in the Europe Composites Market by Value (2019-2025) Table 13.12: Market Size and CAGR of Various Molding Compound in the Europe Composites Market by Value (2026-2035) Table 13.13: Market Size and CAGR of Various Molding Compound in the Europe Composites Market by Volume (2019-2025) Table 13.14: Market Size and CAGR of Various Molding Compound in the Europe Composites Market by Volume (2026-2035) Table 13.15: Market Size and CAGR of Various Resin Type in the Europe Composites Market by Value (2019-2025) Table 13.16: Market Size and CAGR of Various Resin Type in the Europe Composites Market by Value (2026-2035) Table 13.17: Market Size and CAGR of Various Resin Type in the Europe Composites Market by Volume (2019-2025) Table 13.18: Market Size and CAGR of Various Resin Type in the Europe Composites Market by Volume (2026-2035) Table 13.19: Market Size and CAGR of Various Fiber Type in the Europe Composites Market by Value (2019-2025) Table 13.20: Market Size and CAGR of Various Fiber Type in the Europe Composites Market by Value (2026-2035) Table 13.21: Market Size and CAGR of Various Fiber Type in the Europe Composites Market by Volume (2019-2025) Table 13.22: Market Size and CAGR of Various Fiber Type in the Europe Composites Market by Volume (2026-2035) Table 13.23: Market Size and CAGR of Various Fiber Glass Product Form in the Europe Composites Market by Value (2019-2025) Table 13.24: Market Size and CAGR of Various Fiber Glass Product Form in the Europe Composites Market by Value (2026-2035) Table 13.25: Market Size and CAGR of Various Fiber Glass Product Form in the Europe Composites Market by Volume (2019-2025) Table 13.26: Market Size and CAGR of Various Fiber Glass Product Form in the Europe Composites Market by Volume (2026-2035) Table 13.27: Market Size and CAGR of Various Carbon Fiber Type in the Europe Composites Market by Value (2019-2025) Table 13.28: Market Size and CAGR of Various Carbon Fiber Type in the Europe Composites Market by Value (2026-2035) Table 13.29: Market Size and CAGR of Various Carbon Fiber Type in the Europe Composites Market by Volume (2019-2025) Table 13.30: Market Size and CAGR of Various Carbon Fiber Type in the Europe Composites Market by Volume (2026-2035) Table 13.31: Trends and Forecast for the Germany Composites Market (2019-2035) Table 13.32: Trends and Forecast for the France Composites Market (2019-2035) Table 13.33: Trends and Forecast for the Italy Composites Market (2019-2035) Table 13.34: Trends and Forecast for the United Kingdom Composites Market (2019-2035) Table 13.35: Trends and Forecast for the Spain Composites Market (2019-2035) Table 13.36: Trends and Forecast for the Netherlands Composites Market (2019-2035)
Table 14.1: Trends of the APAC Composites Market (2019-2025) Table 14.2: Forecast for the APAC Composites Market (2026-2035) Table 14.3: Market Size and CAGR of Various End Use Industry in the APAC Composites Market by Value (2019-2025) Table 14.4: Market Size and CAGR of Various End Use Industry in the APAC Composites Market by Value (2026-2035) Table 14.5: Market Size and CAGR of Various End Use Industry in the APAC Composites Market by Volume (2019-2025) Table 14.6: Market Size and CAGR of Various End Use Industry in the APAC Composites Market by Volume (2026-2035) Table 14.7: Market Size and CAGR of Various Manufacturing Process in the APAC Composites Market by Value (2019-2025) Table 14.8: Market Size and CAGR of Various Manufacturing Process in the APAC Composites Market by Value (2026-2035) Table 14.9: Market Size and CAGR of Various Manufacturing Process in the APAC Composites Market by Volume (2019-2025) Table 14.10: Market Size and CAGR of Various Manufacturing Process in the APAC Composites Market by Volume (2026-2035) Table 14.11: Market Size and CAGR of Various Molding Compound in the APAC Composites Market by Value (2019-2025) Table 14.12: Market Size and CAGR of Various Molding Compound in the APAC Composites Market by Value (2026-2035) Table 14.13: Market Size and CAGR of Various Molding Compound in the APAC Composites Market by Volume (2019-2025) Table 14.14: Market Size and CAGR of Various Molding Compound in the APAC Composites Market by Volume (2026-2035) Table 14.15: Market Size and CAGR of Various Resin Type in the APAC Composites Market by Value (2019-2025) Table 14.16: Market Size and CAGR of Various Resin Type in the APAC Composites Market by Value (2026-2035) Table 14.17: Market Size and CAGR of Various Resin Type in the APAC Composites Market by Volume (2019-2025) Table 14.18: Market Size and CAGR of Various Resin Type in the APAC Composites Market by Volume (2026-2035) Table 14.19: Market Size and CAGR of Various Fiber Type in the APAC Composites Market by Value (2019-2025) Table 14.20: Market Size and CAGR of Various Fiber Type in the APAC Composites Market by Value (2026-2035) Table 14.21: Market Size and CAGR of Various Fiber Type in the APAC Composites Market by Volume (2019-2025) Table 14.22: Market Size and CAGR of Various Fiber Type in the APAC Composites Market by Volume (2026-2035) Table 14.23: Market Size and CAGR of Various Fiber Glass Product Form in the APAC Composites Market by Value (2019-2025) Table 14.24: Market Size and CAGR of Various Fiber Glass Product Form in the APAC Composites Market by Value (2026-2035) Table 14.25: Market Size and CAGR of Various Fiber Glass Product Form in the APAC Composites Market by Volume (2019-2025) Table 14.26: Market Size and CAGR of Various Fiber Glass Product Form in the APAC Composites Market by Volume (2026-2035) Table 14.27: Market Size and CAGR of Various Carbon Fiber Type in the APAC Composites Market by Value (2019-2025) Table 14.28: Market Size and CAGR of Various Carbon Fiber Type in the APAC Composites Market by Value (2026-2035) Table 14.29: Market Size and CAGR of Various Carbon Fiber Type in the APAC Composites Market by Volume (2019-2025) Table 14.30: Market Size and CAGR of Various Carbon Fiber Type in the APAC Composites Market by Volume (2026-2035) Table 14.31: Trends and Forecast for the Australia Composites Market (2019-2035) Table 14.32: Trends and Forecast for the India Composites Market (2019-2035) Table 14.33: Trends and Forecast for the China Composites Market (2019-2035) Table 14.34: Trends and Forecast for the Japan Composites Market (2019-2035) Table 14.35: Trends and Forecast for the South Korea Composites Market (2019-2035) Table 14.36: Trends and Forecast for the Thailand Composites Market (2019-2035) Table 14.37: Trends and Forecast for the Taiwan Composites Market (2019-2035)
Table 15.1: Trends of the ROW Composites Market (2019-2025) Table 15.2: Forecast for the ROW Composites Market (2026-2035) Table 15.3: Market Size and CAGR of Various End Use Industry in the ROW Composites Market by Value (2019-2025) Table 15.4: Market Size and CAGR of Various End Use Industry in the ROW Composites Market by Value (2026-2035) Table 15.5: Market Size and CAGR of Various End Use Industry in the ROW Composites Market by Volume (2019-2025) Table 15.6: Market Size and CAGR of Various End Use Industry in the ROW Composites Market by Volume (2026-2035) Table 15.7: Market Size and CAGR of Various Manufacturing Process in the ROW Composites Market by Value (2019-2025) Table 15.8: Market Size and CAGR of Various Manufacturing Process in the ROW Composites Market by Value (2026-2035) Table 15.9: Market Size and CAGR of Various Manufacturing Process in the ROW Composites Market by Volume (2019-2025) Table 15.10: Market Size and CAGR of Various Manufacturing Process in the ROW Composites Market by Volume (2026-2035) Table 15.11: Market Size and CAGR of Various Molding Compound in the ROW Composites Market by Value (2019-2025) Table 15.12: Market Size and CAGR of Various Molding Compound in the ROW Composites Market by Value (2026-2035) Table 15.13: Market Size and CAGR of Various Molding Compound in the ROW Composites Market by Volume (2019-2025) Table 15.14: Market Size and CAGR of Various Molding Compound in the ROW Composites Market by Volume (2026-2035) Table 15.15: Market Size and CAGR of Various Resin Type in the ROW Composites Market by Value (2019-2025) Table 15.16: Market Size and CAGR of Various Resin Type in the ROW Composites Market by Value (2026-2035) Table 15.17: Market Size and CAGR of Various Resin Type in the ROW Composites Market by Volume (2019-2025) Table 15.18: Market Size and CAGR of Various Resin Type in the ROW Composites Market by Volume (2026-2035) Table 15.19: Market Size and CAGR of Various Fiber Type in the ROW Composites Market by Value (2019-2025) Table 15.20: Market Size and CAGR of Various Fiber Type in the ROW Composites Market by Value (2026-2035) Table 15.21: Market Size and CAGR of Various Fiber Type in the ROW Composites Market by Volume (2019-2025) Table 15.22: Market Size and CAGR of Various Fiber Type in the ROW Composites Market by Volume (2026-2035) Table 15.23: Market Size and CAGR of Various Fiber Glass Product Form in the ROW Composites Market by Value (2019-2025) Table 15.24: Market Size and CAGR of Various Fiber Glass Product Form in the ROW Composites Market by Value (2026-2035) Table 15.25: Market Size and CAGR of Various Fiber Glass Product Form in the ROW Composites Market by Volume (2019-2025) Table 15.26: Market Size and CAGR of Various Fiber Glass Product Form in the ROW Composites Market by Volume (2026-2035) Table 15.27: Market Size and CAGR of Various Carbon Fiber Type in the ROW Composites Market by Value (2019-2025) Table 15.28: Market Size and CAGR of Various Carbon Fiber Type in the ROW Composites Market by Value (2026-2035) Table 15.29: Market Size and CAGR of Various Carbon Fiber Type in the ROW Composites Market by Volume (2019-2025) Table 15.30: Market Size and CAGR of Various Carbon Fiber Type in the ROW Composites Market by Volume (2026-2035) Table 15.31: Trends and Forecast for the Brazil Composites Market (2019-2035) Table 15.32: Trends and Forecast for the South Africa Composites Market (2019-2035)

Methodology

Lucintel has been in the business of market research and management consulting since 2000 and has published over 1000 market intelligence reports in various markets / applications and served over 1,000 clients worldwide. This study is a culmination of four months of full-time effort performed by Lucintel's analyst team. The analysts used the following sources for the creation and completion of this valuable report:

  • In-depth interviews of the major players in this market
  • Detailed secondary research from competitors' financial statements and published data
  • Extensive searches of published works, market, and database information pertaining to industry news, company press releases, and customer intentions
  • A compilation of the experiences, judgments, and insights of Lucintel's professionals, who have analyzed and tracked this market over the years.

Extensive research and interviews are conducted across the supply chain of this market to estimate market share, market size, trends, drivers, challenges, and forecasts. Below is a brief summary of the primary interviews that were conducted by job function for this report.

Lucintel's methodology for market research

Thus, Lucintel compiles vast amounts of data from numerous sources, validates the integrity of that data, and performs a comprehensive analysis. Lucintel then organizes the data, its findings, and insights into a concise report designed to support the strategic decision-making process. The figure below is a graphical representation of Lucintel's research process.

Primary interviews by job function

Buy Now

Choose a license that fits your team. Instant PDF delivery.

Market Report

1 User PDF

$4,850
Buy Now

Market Report

2-5 Users PDF

$6,700
Buy Now

Market Report

Corporate PDF

$8,850
Buy Now

Market Report

Global PDF

$10,000
Buy Now

Prices exclude taxes. Instant delivery. Custom licensing available on request.

Frequently Asked Questions

What is the composites market size?
The global composites market is expected to reach an estimated $70 billion by 2035.
What is the growth forecast for composites market?
The global composites market is expected to grow with a CAGR of 4.1% from 2026 to 2035.
What are the major drivers influencing the growth of the composites market?
The major drivers for this market are growing demand in automotive and aerospace sectors for lightweight, high-strength materials drives composites adoption to improve fuel efficiency and reduce emissions, expansion in construction, wind energy, and marine sectors boosts composites use due to corrosion resistance, durability, and long service life and innovations in resin systems, fiber reinforcement, and processes like injection molding and automated layup enhance performance, reduce costs, and expand composites applications.
What are the major segments for composites market?
The future of the composites market looks promising with opportunities in the pan based carbon fiber and pitch based carbon fiber markets.
Who are the key composites market companies?

Some of the key composites market companies are as follows:

  • Praana Group (Owens Corning)
  • Jushi Group
  • Nippon Electric Glass
  • CPIC
  • Taishan Fiberglass Inc.
  • Toray Industries Inc.
  • Hexcel Corporation
  • Mitsubishi Chemical Group
  • Syensqo
  • SGL Carbon
  • Teijin Limited
  • DuPont
  • Polynt Group
  • INEOS Composites (KPS Capital Partners)
  • AOC (Nippon Paint Holdings)
  • Boeing
  • Airbus
  • Honeywell
  • Trek
  • General Motors Corporation
Which composites market segment will be the largest in future?
Lucintel forecasts that, within the end use industry category, transportation will remain the largest segment over the forecast period.
In composites market, which region is expected to be the largest in next 9 years?
In terms of region, APAC is expected to witness the highest growth over the forecast period.
Do we receive customization in this report?
Yes, lucintel provides 10% customization without any additional cost.

Key Questions

  • What are some of the most promising, high-growth opportunities for the composites market by end use industry (transportation, marine, wind energy, aerospace, pipe and tank, construction, electrical and electronics, consumer goods, and other end use industries), manufacturing process (hand lay-up, spray-up, resin infusion (rrim, rtm, vartm), filament winding, pultrusion, injection molding, compression molding, prepreg lay-up, and other manufacturing processes), molding compound (smc, bmc, and thermoplastic compounds ( sft, lft, gmt, cft and other)), resin type (polyester, epoxy, vinyl ester, phenolic, and thermoplastics), fiber type (glass fiber, carbon fiber, and aramid fiber), fiber glass product form (single end roving, multi end roving, ducs, continuous filament mat, and yarn), carbon fiber type (pan based carbon fiber and pitch based carbon fiber), and region (North America, Europe, Asia Pacific, and the Rest of the World)?
  • Which segments will grow at a faster pace and why?
  • Which region will grow at a faster pace and why?
  • What are the key factors affecting market dynamics? What are the key challenges and business risks in this market?
  • What are the business risks and competitive threats in this market?
  • What are the emerging trends in this market and the reasons behind them?
  • What are some of the changing demands of customers in the market?
  • What are the new developments in the market? Which companies are leading these developments?
  • Who are the major players in this market? What strategic initiatives are key players pursuing for business growth?
  • What are some of the competing products in this market and how big of a threat do they pose for loss of market share by material or product substitution?
  • What M&A activity has occurred in the last 9 years, and what has its impact been on the industry?
Why Choose Us

The Lucintel Advantage

Trusted partner for strategic intelligence and business growth

25+ Years Excellence

25+ Years Excellence

Quarter century of proven expertise in management consulting and market research across global markets.
Game-Changer Ideas

Game-Changer Ideas

Innovative strategies and actionable insights that help clients become the smartest in their industry.
Global Reach

Global Reach

Extensive coverage across 50+ industries and markets worldwide with localized expertise.
Start Your Growth Journey

Get Your Free
Market Intelligence
Briefing

Receive a complimentary market analysis tailored to your industry. Our analysts will identify key growth opportunities and competitive dynamics specific to your business.

Custom Market Snapshot

Market size, growth rate, and key trend analysis for your specific sector.

Competitive Landscape Overview

Top competitor positioning and market share analysis.

Growth Opportunity Identification

Strategic recommendations backed by data-driven insights.

Subscribe

Subscribe to our Newsletter

Get curated market intelligence and competitive moves straight to your inbox.

By subscribing, you agree to receive our monthly insights. Unsubscribe anytime.

Industry Trends Market Signals Opportunities Competitor Moves